
Research ArticleImmunologyOncology
Open Access |  10.1172/jci.insight.203622
A platform for parallel TCR cloning and testing enables anti-neoantigen tumor immunotherapy
Alexander M. Rowe,1 Smriti Chaurasia,1 Wenzhong Wei,1,2 Laura García-Diéguez,1,2 Katherine Tempro,1 Johnathon G. Schiebel,1 Christy Smolak,1 Alexander Muralles,3 Daniel Wikenheiser,1,3 Kevin Quann,2 Collin Pirner,2 Kentin Codispot,2 Mark J. Shlomchik,1 and Warren D. Shlomchik1,2,4
1Department of Immunology, University of Pittsburgh, Pittsburgh, Pennsylvania, USA.
2Department of Medicine, Division of Oncology and Malignant Hematology, Pittsburgh, Pennsylvania, USA.
3Bluesphere Bio, Pittsburgh, Pennsylvania, USA.
4Starzl Transplant Institute, Pittsburgh, Pennsylvania, USA.
Address correspondence to: Warren D. Shlomchik, University of Pittsburgh, Assembly Building Room 3055, 5051 Centre Avenue, Pittsburgh, Pennsylvania 15213, USA. Email: warrens@pitt.edu.
Authorship note: AMR and SC contributed equally to this work. MJS and WDS are co–corresponding and co–senior authors.
Find articles by Rowe, A. in: PubMed | Google Scholar
1Department of Immunology, University of Pittsburgh, Pittsburgh, Pennsylvania, USA.
2Department of Medicine, Division of Oncology and Malignant Hematology, Pittsburgh, Pennsylvania, USA.
3Bluesphere Bio, Pittsburgh, Pennsylvania, USA.
4Starzl Transplant Institute, Pittsburgh, Pennsylvania, USA.
Address correspondence to: Warren D. Shlomchik, University of Pittsburgh, Assembly Building Room 3055, 5051 Centre Avenue, Pittsburgh, Pennsylvania 15213, USA. Email: warrens@pitt.edu.
Authorship note: AMR and SC contributed equally to this work. MJS and WDS are co–corresponding and co–senior authors.
Find articles by Chaurasia, S. in: PubMed | Google Scholar
1Department of Immunology, University of Pittsburgh, Pittsburgh, Pennsylvania, USA.
2Department of Medicine, Division of Oncology and Malignant Hematology, Pittsburgh, Pennsylvania, USA.
3Bluesphere Bio, Pittsburgh, Pennsylvania, USA.
4Starzl Transplant Institute, Pittsburgh, Pennsylvania, USA.
Address correspondence to: Warren D. Shlomchik, University of Pittsburgh, Assembly Building Room 3055, 5051 Centre Avenue, Pittsburgh, Pennsylvania 15213, USA. Email: warrens@pitt.edu.
Authorship note: AMR and SC contributed equally to this work. MJS and WDS are co–corresponding and co–senior authors.
Find articles by Wei, W. in: PubMed | Google Scholar
1Department of Immunology, University of Pittsburgh, Pittsburgh, Pennsylvania, USA.
2Department of Medicine, Division of Oncology and Malignant Hematology, Pittsburgh, Pennsylvania, USA.
3Bluesphere Bio, Pittsburgh, Pennsylvania, USA.
4Starzl Transplant Institute, Pittsburgh, Pennsylvania, USA.
Address correspondence to: Warren D. Shlomchik, University of Pittsburgh, Assembly Building Room 3055, 5051 Centre Avenue, Pittsburgh, Pennsylvania 15213, USA. Email: warrens@pitt.edu.
Authorship note: AMR and SC contributed equally to this work. MJS and WDS are co–corresponding and co–senior authors.
Find articles by García-Diéguez, L. in: PubMed | Google Scholar
1Department of Immunology, University of Pittsburgh, Pittsburgh, Pennsylvania, USA.
2Department of Medicine, Division of Oncology and Malignant Hematology, Pittsburgh, Pennsylvania, USA.
3Bluesphere Bio, Pittsburgh, Pennsylvania, USA.
4Starzl Transplant Institute, Pittsburgh, Pennsylvania, USA.
Address correspondence to: Warren D. Shlomchik, University of Pittsburgh, Assembly Building Room 3055, 5051 Centre Avenue, Pittsburgh, Pennsylvania 15213, USA. Email: warrens@pitt.edu.
Authorship note: AMR and SC contributed equally to this work. MJS and WDS are co–corresponding and co–senior authors.
Find articles by Tempro, K. in: PubMed | Google Scholar
1Department of Immunology, University of Pittsburgh, Pittsburgh, Pennsylvania, USA.
2Department of Medicine, Division of Oncology and Malignant Hematology, Pittsburgh, Pennsylvania, USA.
3Bluesphere Bio, Pittsburgh, Pennsylvania, USA.
4Starzl Transplant Institute, Pittsburgh, Pennsylvania, USA.
Address correspondence to: Warren D. Shlomchik, University of Pittsburgh, Assembly Building Room 3055, 5051 Centre Avenue, Pittsburgh, Pennsylvania 15213, USA. Email: warrens@pitt.edu.
Authorship note: AMR and SC contributed equally to this work. MJS and WDS are co–corresponding and co–senior authors.
Find articles by Schiebel, J. in: PubMed | Google Scholar
1Department of Immunology, University of Pittsburgh, Pittsburgh, Pennsylvania, USA.
2Department of Medicine, Division of Oncology and Malignant Hematology, Pittsburgh, Pennsylvania, USA.
3Bluesphere Bio, Pittsburgh, Pennsylvania, USA.
4Starzl Transplant Institute, Pittsburgh, Pennsylvania, USA.
Address correspondence to: Warren D. Shlomchik, University of Pittsburgh, Assembly Building Room 3055, 5051 Centre Avenue, Pittsburgh, Pennsylvania 15213, USA. Email: warrens@pitt.edu.
Authorship note: AMR and SC contributed equally to this work. MJS and WDS are co–corresponding and co–senior authors.
Find articles by Smolak, C. in: PubMed | Google Scholar
1Department of Immunology, University of Pittsburgh, Pittsburgh, Pennsylvania, USA.
2Department of Medicine, Division of Oncology and Malignant Hematology, Pittsburgh, Pennsylvania, USA.
3Bluesphere Bio, Pittsburgh, Pennsylvania, USA.
4Starzl Transplant Institute, Pittsburgh, Pennsylvania, USA.
Address correspondence to: Warren D. Shlomchik, University of Pittsburgh, Assembly Building Room 3055, 5051 Centre Avenue, Pittsburgh, Pennsylvania 15213, USA. Email: warrens@pitt.edu.
Authorship note: AMR and SC contributed equally to this work. MJS and WDS are co–corresponding and co–senior authors.
Find articles by Muralles, A. in: PubMed | Google Scholar
1Department of Immunology, University of Pittsburgh, Pittsburgh, Pennsylvania, USA.
2Department of Medicine, Division of Oncology and Malignant Hematology, Pittsburgh, Pennsylvania, USA.
3Bluesphere Bio, Pittsburgh, Pennsylvania, USA.
4Starzl Transplant Institute, Pittsburgh, Pennsylvania, USA.
Address correspondence to: Warren D. Shlomchik, University of Pittsburgh, Assembly Building Room 3055, 5051 Centre Avenue, Pittsburgh, Pennsylvania 15213, USA. Email: warrens@pitt.edu.
Authorship note: AMR and SC contributed equally to this work. MJS and WDS are co–corresponding and co–senior authors.
Find articles by Wikenheiser, D. in: PubMed | Google Scholar
1Department of Immunology, University of Pittsburgh, Pittsburgh, Pennsylvania, USA.
2Department of Medicine, Division of Oncology and Malignant Hematology, Pittsburgh, Pennsylvania, USA.
3Bluesphere Bio, Pittsburgh, Pennsylvania, USA.
4Starzl Transplant Institute, Pittsburgh, Pennsylvania, USA.
Address correspondence to: Warren D. Shlomchik, University of Pittsburgh, Assembly Building Room 3055, 5051 Centre Avenue, Pittsburgh, Pennsylvania 15213, USA. Email: warrens@pitt.edu.
Authorship note: AMR and SC contributed equally to this work. MJS and WDS are co–corresponding and co–senior authors.
Find articles by Quann, K. in: PubMed | Google Scholar
1Department of Immunology, University of Pittsburgh, Pittsburgh, Pennsylvania, USA.
2Department of Medicine, Division of Oncology and Malignant Hematology, Pittsburgh, Pennsylvania, USA.
3Bluesphere Bio, Pittsburgh, Pennsylvania, USA.
4Starzl Transplant Institute, Pittsburgh, Pennsylvania, USA.
Address correspondence to: Warren D. Shlomchik, University of Pittsburgh, Assembly Building Room 3055, 5051 Centre Avenue, Pittsburgh, Pennsylvania 15213, USA. Email: warrens@pitt.edu.
Authorship note: AMR and SC contributed equally to this work. MJS and WDS are co–corresponding and co–senior authors.
Find articles by Pirner, C. in: PubMed | Google Scholar
1Department of Immunology, University of Pittsburgh, Pittsburgh, Pennsylvania, USA.
2Department of Medicine, Division of Oncology and Malignant Hematology, Pittsburgh, Pennsylvania, USA.
3Bluesphere Bio, Pittsburgh, Pennsylvania, USA.
4Starzl Transplant Institute, Pittsburgh, Pennsylvania, USA.
Address correspondence to: Warren D. Shlomchik, University of Pittsburgh, Assembly Building Room 3055, 5051 Centre Avenue, Pittsburgh, Pennsylvania 15213, USA. Email: warrens@pitt.edu.
Authorship note: AMR and SC contributed equally to this work. MJS and WDS are co–corresponding and co–senior authors.
Find articles by Codispot, K. in: PubMed | Google Scholar
1Department of Immunology, University of Pittsburgh, Pittsburgh, Pennsylvania, USA.
2Department of Medicine, Division of Oncology and Malignant Hematology, Pittsburgh, Pennsylvania, USA.
3Bluesphere Bio, Pittsburgh, Pennsylvania, USA.
4Starzl Transplant Institute, Pittsburgh, Pennsylvania, USA.
Address correspondence to: Warren D. Shlomchik, University of Pittsburgh, Assembly Building Room 3055, 5051 Centre Avenue, Pittsburgh, Pennsylvania 15213, USA. Email: warrens@pitt.edu.
Authorship note: AMR and SC contributed equally to this work. MJS and WDS are co–corresponding and co–senior authors.
Find articles by
Shlomchik, M.
in:
PubMed
|
Google Scholar
|

1Department of Immunology, University of Pittsburgh, Pittsburgh, Pennsylvania, USA.
2Department of Medicine, Division of Oncology and Malignant Hematology, Pittsburgh, Pennsylvania, USA.
3Bluesphere Bio, Pittsburgh, Pennsylvania, USA.
4Starzl Transplant Institute, Pittsburgh, Pennsylvania, USA.
Address correspondence to: Warren D. Shlomchik, University of Pittsburgh, Assembly Building Room 3055, 5051 Centre Avenue, Pittsburgh, Pennsylvania 15213, USA. Email: warrens@pitt.edu.
Authorship note: AMR and SC contributed equally to this work. MJS and WDS are co–corresponding and co–senior authors.
Find articles by Shlomchik, W. in: PubMed | Google Scholar
Published April 28, 2026 - More info
JCI Insight. 2026;11(12):e203622. https://doi.org/10.1172/jci.insight.203622.
© 2026 Rowe et al. This work is licensed under the Creative Commons Attribution 4.0 International License. To view a copy of this license, visit http://creativecommons.org/licenses/by/4.0/.


-
Results
Cloning TCRs from TILs.
C57Bl/6 (B6) mice were injected intradermally with MC38-Leiden cells (hereafter MC38 cells) and followed for tumor growth (Figure 1A). We chose to study the response against MC38 cells given its in vivo immunogenicity, which suggests a high tumor mutation burden. From tumors 1 and 5, we single cell–sorted 320 tumor-infiltrating CD45+CD8+TCRβ+CD11b–CD4– cells into 384-well plates; approximately a third of these cells were PD-1hi (Figure 1B). TCRα and TCRβ variable regions were amplified from single cells (See Methods, Supplemental Methods, and Figure 1C) employing single-cell cDNA synthesis and a nested PCR-based TCR amplification strategy using a custom primer set (Supplemental Table 1) that adds ends for Gibson cloning. These amplified products were purified and then Gibson assembled with 2 other DNA molecules: (a) a fragment encoding the TCRα constant region; and (b) a retroviral backbone that includes the TCRβ constant region. Both the amplified TCRα and TCRβ variable regions were cloned in frame to the constant regions, thereby creating an expressible TCR (Figure 1C). Next, 94 and 92 purified TCRα/TCRβ pairs (Supplemental Figure 1, A–D) from tumors 1 and 5 (respectively), were Gibson assembled into the retroviral backbone, which also encodes mCherry and a puromycin resistance gene (puroR; Figure 1C). Each Gibson product was transfected into bacteria, and plasmid was purified from these bulk cultures without the prior isolation of individual colonies. VSV-G–pseudotyped retrovirus was generated from the resultant plasmid DNA, followed by transduction of Jurkat reporter cells modified to express human CD8α with CRISPR/Cas9 inactivation of TCRα and TCRβ genes. Mouse TCRs function in human T cells (including Jurkat cells), and human CD8α recognizes mouse MHCI molecules (33–36).
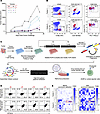 Figure 1
MC38 tumor establishment and cloning of TCRs from single cell–sorted tumor-infiltrating CD8 cells. (A) B6 mice were injected intradermally with 5 × 10⁵ MC38 cells and monitored for tumor growth. (B) Four weeks later, tumors from mouse 1 and 5 were harvested and digested and CD45+CD8+ CD44+TCRβ+CD11b–CD4– cells were single cell–sorted for cloning. Sorted cells are depicted in red; percentages in gates are from an analytic sample collected just prior to sorting. PD-1 expression was captured but was not a sort-parameter. The TCXpress process is shown in (C). cDNA is generated within each well followed by first round amplification of the TCRα and TCRβ variable regions. The product is split, and TCRα and TCRβ chains are separately amplified, simultaneously adding ends for Gibson cloning. These are assembled with a TCRα constant region (TRAC) fragment and an MSCV-based vector that includes the TCRβ constant region (TRBC). Compatible Gibson cloning ends are color coded. E. coli are transformed with the Gibson product, followed by plasmid and retrovirus generation. (D) TCRβ and mCherry expression of Jurkat cell lines transduced with TCRs J8, J9, J10, and J11 before and after puromycin selection. J8 did not express a functional TCR despite puromycin enriching for mCherry+ cells. (E) Heatmaps representing percentages of TCRβ+ cells for each TCR-transduced Jurkat culture, before and after puromycin selection. Flow cytometry data from Jurkat lines in the red boxes are shown in D.
Transduced Jurkat lines were puromycin-selected, which increased the percentages of mCherry+TCRβ+ cells, yielding 145 TCRβ+ lines (78% of input Gibson reactions; Figure 1, D and E). That there were lines with very low or no detectable TCR expression despite their being mCherry+ may have been due to infidelity in TCR amplification and/or the Gibson assembly.
Creating APCs expressing putative neoantigens.
To identify potential MC38-encoded neoantigens, we compared whole-genome sequencing data of our MC38 cells with the reference B6 genome GRCm38. We used published MC38 RNA-Seq data (37) to identify putative neoantigens derived from expressed genes. From these data, we generated a list of neoantigens created by nonsynonymous mutations, deletions, or frameshift mutations (Supplemental Table 2).
To assess whether putative neoantigens were targets of cloned TCRs, we cocultured TCR-expressing Jurkat cells with B6WT3 APCs engineered to stably express TMGs encoding up to 8 putative neoantigens. Within the TMGs, each putative neoantigen-containing peptide was represented by at least 25 aa, with the predicted MHCI-binding peptide in the center (Supplemental Table 2). Each TMG sequence was flanked by Kb-restricted epitopes from OVA (SIINFEKL) on the amino terminus and the minor histocompatibility antigen H60 (LTFNYRNL) on the carboxy terminus (Figure 2A) (38, 39). The inclusion of these defined antigens allowed us to use reporter cells expressing OVA or H60-reactive TCRs as positive controls for minigene epitope expression. Further, we could screen for construct expression using the 25D1 antibody, which recognizes Kb-SIINFEKL complexes (40). These TMG constructs were Gibson-cloned into a retroviral vector similar to that used to express TCRs (Supplemental Figure 2A) and retrovirus was generated. B6WT3 cells were infected with single TMG-encoding retroviruses and puromycin-selected, which led to clear 25D1 staining (Supplemental Figure 2B). In this fashion, a library of TMG-expressing B6WT3 sublines was produced to represent all of the neoantigen targets.
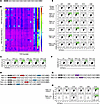 Figure 2
Identification of neoantigen-reactive TCRs. (A) TMGs encoding putative neoantigens flanked by epitopes from OVA (SIINFEKL) and H60 (LTFNYRNL) were cloned into retroviral vectors; see also Supplemental Figure 2A. (B) Pools of 5 Jurkat lines (quintets), each expressing a TCR cloned from a single cell, were cocultured with B6WT3 cells transduced with TMG retroviruses. The percentage of CD69+ cells in each culture was determined by flow cytometry and plotted as a heatmap. (C) Representative flow plots from quintet 1 showing reactivities against B6WT3 cells expressing TMGs 3.0, 3.4, 3.6, 3.22, 3.36 or an empty vector (EV) negative control. (D) Putative neoantigens encoded by TMGs 3.0, 3.4, 3.5, 3.6, 3.22, and 3.26. The individual resource lines from quintet 1 were separately cocultured with TMGs 3.0, 3.4, 3.6, 3.22, and 3.26. (E) TCR A09 reacted with TMGs 3.0, 3.4, and 3.22, which shared expression of Rpl18, whereas TCR A10 reacted with TMGs 3.0, 3.6, and 3.26, which shared expression of ADPGK. (F and G) Quintet 22 reacted with TMGs 3.9 and 3.23, which only shared expression of PSMD2. (H) The single lines from quintet 22 were individually cultured with TMG-APCs 3.9 and 3.23, revealing TCR G13 to be reactive against PSMD2.
We created 26 B6WT3 lines expressing 100 putative neoantigens. Each neoantigen was expressed in at least 2 different constructs (assemblies 1 and 2; Supplemental Figure 2C) to facilitate the decoding of TCR reactivities from a single screen. TMG construct 3.0 encoded 8 putative neoantigens identified by others, which were also identified by our analyses (37, 41). Prior to coculturing TMG-encoding APC lines with TCR-transduced Jurkat lines, they were treated with IFN-γ to enhance their APC function, which predictably led to upregulation of MHCI (Supplemental Figure 2D).
We combined individual TCR-expressing Jurkat lines into groups of 5 (quintets). Each quintet was cocultured with each TMG-expressing B6WT3 line and then assessed for CD69 upregulation. As negative controls, each quintet was cocultured with B6WT3 cells infected with an empty vector (EV) and B6WT3 cells that were CRISPR-edited to lack Kb or Kb and Db. Quintets were also cocultured with B6 BM-derived DCs and IFN-γ–treated MC38 cells to test for autoreactivity or tumor recognition, respectively.
We observed 2 broad types of reactivity (Figure 2B). Some quintets reacted against specific TMGs (e.g., quintets 1, 21, and 22), whereas others reacted against most TMGs (quintets 28 and 29) and also against MC38 cells and DCs. It was expected that the percentages of CD69+ cells in “positive” quintets would be low because typically only 1 of 5 lines would be reactive. Furthermore, fewer than 100% of cells from each line would be expected to express the correct TCR due to expression of the wrong TCRα chain, potential nucleic acid amplification errors, and their derivation from plasmid generated from the entire Gibson cloning reaction, without the selection of colonies encoding a single correctly assembled TCRα/TCRβ pair.
Quintet 1 reacted against TMGs 3.0, 3.4, 3.6, 3.22, and 3.26 (Figure 2C). That TMG 3.0 induced the highest percentage of CD69+ cells among quintet 1 suggested that quintet 1 might contain 2 positive TCRs. Inspection of the neoantigen identities (Figure 2D) revealed that Rpl18 was expressed in TMGs 3.0, 3.4, and 3.22, while ADPGK was expressed by TMGs 3.0, 3.6, and 3.26, suggesting that quintet 1 had TCRs reactive against mutant Rpl18 and ADPGK (Rpl18mut; ADPGKmut).
To determine which TCRs within quintet 1 were reactive and against which neoantigens, we cultured each single Jurkat line with each TMG APC (Figure 2E). TCR A09 reacted against TMGs 3.0, 3.4, and 3.22, which only shared Rpl18mut. TCR A10 reacted against TMGs 3.0, 3.6, and 3.26, which only had ADPGKmut in common. Therefore, quintet 1 had 2 anti-neoantigen TCRs, one each reactive against Rpl18mut or ADPGKmut. Using this same approach, we identified additional Rpl18mut-reactive TCRs from quintets 3, 6, 20, and 21 (Table 1).
Quintet 22 reacted against TMGs 3.9 and 3.23 (Figure 2F), which shared a mutant PSMD2 (Figure 2G); one-to-one cultures mapped reactivity to clone G13 (Figure 2H). Several quintets reacted against TMG 3.12. However, they did not react against TMGs in assembly 2 that expressed the same putative neoantigens; this reactivity was not pursued further.
Rpl18mut and ADPGKmut have been described as targets for anti-MC38 CD8 responses (37, 41) and our cloning of multiple anti-Rpl18mut TCRs confirms this. To focus on other neoantigens, we performed a second TCR cloning campaign aiming to exclude TCRs reactive against Rpl18mut or ADPGKmut. MC38 cells were implanted (Supplemental Figure 3A) and TILs were isolated. In an attempt to omit Rpl18mut- and ADPGKmut-reactive cells, we stained cells with MHCI-dextramers against Rpl18mut (dexRpl18) and ADPGKmut (dexADPGK). There was a clear dexRpl18+ but not a dexADPGK+ population. We thus single cell–sorted 352 dexRpl18– cells with low dexADPGK staining (Supplemental Figure 3B) and cloned TCRs as in Figure 1. In this campaign, we sequenced TCRβ chains prior to choosing which TCRs to advance to Gibson cloning, enabling us to prioritize TCRs isolated more than once and to limit repeated screening of multiple isolates of expanded clones. We cloned 187 TCRs into retroviral vectors with 184 of the TCR-transduced Jurkat lines expressing TCRβ. Next, 150 transduced Jurkat lines with the best TCRβ expression were screened against the TMG APC library (Supplemental Figure 3C). Of these, 28 TCRs were from clones captured more than once (Supplemental Figure 3D).
In addition to screening these new TCRs against our original TMG library, we returned to the genome sequencing data and selected an additional 112 putative neoantigens for screening (Supplemental Table 2, Supplemental Figure 2, and Supplemental Figure 3E). We incorporated these into 2 assemblies totaling 28 TMG constructs, with each neoantigen represented in a different context in each assembly (TMGs 4.1 to 4.14 and TMGs 4.15 to 4.28). Thirty quintets from the second TCR library were cocultured with APCs expressing TMGs 4.1 to 4.14 and APCs expressing TMGs 3.0 to 3.13 from the first screen (Supplemental Figure 3F).
TMGs 3.0 and 3.4 were reactive against quintets 4, 9, 12, 13, and 14, which only shared Rpl18mut. By reacting the individual Jurkat lines against TMG APCs 3.0 and 3.4, we identified 7 unique anti-Rpl18mut TCRs (Table 1). That these were isolated from dexRpl18– cells may reflect that TCRs were downregulated sufficiently prior to staining to diminish dextramer binding.
TMG 4.8 reacted against quintets 3, 7, 8, 9, 10, 19, 25, and 30. We cocultured each of the individual Jurkat lines from these quintets with TMG 4.8 APCs; the positive lines were cocultured with the second APC assembly (TMGs 4.15 to 4.28). At least 1 individual culture from each of these quintets was reactive only against TMGs 4.8 and 4.23, which share an epitope derived from the zinc finger protein Zc3h7b. For example, quintet 19 reacted against TMG 4.8 (Supplemental Figure 3G). From quintet 19, only clone J18 reacted against TMGs 4.8 and 4.23 (Supplemental Figure 3, I and J). In total, 10 TCRs reactive against Zc3h7bmut were isolated, of which 9 were unique (Table 1). From these quintets, we also identified additional anti-Rpl18mut TCRs (Table 1). By screening TCRs from our first campaign against TMG library 4, we found 1 additional anti-Zc3h7bmut TCR (Table 1).
Molecular deconvolution.
As a consequence of our Gibson-cloning process, the resultant plasmid DNA contained a mix of molecular species that could include more than 1 TCRα chain along with errors acquired during amplification and cloning. To isolate a single molecular TCRα/TCRβ pair for downstream work, plasmid DNA isolates derived from the Gibson reactions that generated the reactive TCRs were transformed into bacteria and single colonies were used to create retrovirus, followed by transduction of reporter cells.
An example of this process is the deconvolution of the anti-Rpl18 TCR H03. Among the 8 Jurkat lines derived from 8 colony picks, there was surface TCR expression in 7 (Supplemental Figure 4A). Interpretable TCRα and TCRβ sequences were obtained from 6 colonies (Supplemental Figure 4B), all of which used TRAV14-D-1 and TRBV20. However, there were 2 TRAJ-TRAC junctions, reflecting independent TRAV14-D-1 rearrangements, with picks 3, 4, 5, and 7 having one junction and 6 and 8 the other junction. We cocultured Jurkat reporter cells expressing picks 4, 6, 7, and 8 against B6WT3 cells transduced with Rpl18+PSMD2– TMG 3.4 and Rpl18–PSMD2+TMG 3.23. Only cells expressing picks 6 and 8 (Supplemental Figure 4C), sharing the second TCRα rearrangement, supported CD69 upregulation, thereby identifying the correct TCR. We performed a parallel process to deconvolute the anti-PDSM2 TCR G13 (Supplemental Figure 4, D–F). This process of molecular deconvolution was repeated for most Jurkat lines that reacted against 2 TMG APCs that encoded a common putative neoantigen and therefore were likely bona fide.
Isolation of autoreactive TCRs.
In the first screen, TCR pools 9, 25, 27, 28, and 29 had broad reactivities against all TMG-encoding B6WT3 lines (Figure 2B), B6 BM DCs, and MC38 tumor cells. Importantly, these pools did not react against B6WT3 cells lacking Kb and Db, indicating MHCI-dependent reactivities. We cocultured each of the single Jurkat lines from these pools against MC38 cells, identifying 7 that were reactive. Molecular deconvolution of these lines isolated a unique autoreactive TCR from each line (Supplemental Figure 5A). Jurkat cells expressing these deconvoluted TCRs were reacted against MC38 cells and WT or Kb- or Db-deficient B6WT3 cells. Clones A16, A22, D17, and I15 were Db-restricted; the rest were Kb-restricted. In the second screen of TCRs from MC38 TIL, quintets 7, 8, 10, 13, 17, 20, and 21 had broad reactivity. From these quintets, 9 individual Jurkat lines responded to both B6WT3 and MC38 cells, demonstrating that autoreactive TCRs were common. We did not pursue these latter TCRs further due to resource restraints.
Treatment of B16 melanoma with TCR-transduced products.
To facilitate testing of whether T cells transduced with neoantigen-specific TCRs would be effective against MC38 tumors in vivo, we needed to develop methods for creating TCR-redirected products. We sought a well-characterized TCR and a well-characterized in vivo tumor model in order to optimize cell production. Thus, we tested these T cell products in vivo against a B16 melanoma subclone modified to express a TMG encoding epitopes from gp100, H60, TRP1, TRP2, and OVA (B16-TMG; Supplemental Figure 6A). The modified subclone was killed in vitro by activated anti-SIINFEKL OT-1 TCR transgenic T cells (Supplemental Figure 6B) and grew similarly in B6 mice as did parental B16-F10 cells (Supplemental Figure 6C). When implanted, B16-TMG cells generated anti-OVA and anti-H60 CD8 responses (Supplemental Figure 6D). This B16-TMG line was successfully treated in vivo by the adoptive transfer of expanded OT-1 TCR transgenic cells (Supplemental Figure 6E).
To explore optimal expression vectors, we cloned the OT-1 TCRα and TCRβ chains, separated by a T2A sequence, into 2 retroviral backbones. In one, 3′ to the TCR cassette was an IRES-EGFP segment followed by a WPRE sequence; in the second, the IRES-EGFP was deleted but the WPRE sequence was retained (“no-fluoro” vector). To knock down endogenous TCRs, we designed guide RNAs (gRNAs) targeting the constant regions of TCRα and TCRβ; all TCRs studied with transduced products had constant regions modified to be resistant to these gRNAs.
In a first approach (TCX 1.0, Figure 3A), T cells were activated with anti-CD3/CD28 Dynabeads in IL-2 for 2 days, followed by electroporation with Cas9/gRNA complexes. Cells were then transduced with OT-1 TCR-encoding retrovirus, followed by culture in IL-2 for 6 days. Carefully titered retrovirus (Supplemental Figure 7) was used to assure consistent MOI across products. TCRα and TCRβ editing was efficient (Figure 3, B and C). When cells were TCR-transduced without CRISPR editing, TCRβ expression was similar to that in cells that underwent neither TCR transduction nor TCR editing (Figure 3B). However, with combined TCR editing and TCR transduction, TCR expression was lower, as most TCR was derived from integrated retrovirus.
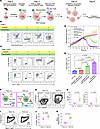 Figure 3
Development of TCX 1.0 and TCX 2.0 T cell products. (A) Schematic for TCX 1.0 production. Purified splenic T cells were activated with anti-CD3/CD28 Dynabeads and IL-2 for 2 days. De-beaded cells underwent TCRα/TCRβ chain deletion via electroporation of gRNA/Cas9 complexes. After resting for 1 hour, these cells were transduced with OT-1 TCR-encoding retrovirus (coexpresses GFP) and cultured for 6 additional days in IL-2. (B and C) Characteristics of cells manufactured as in A, with or without CRISPR-TCR deletion or retroviral transduction. (B) Staining for TCRβ and CD8 (gated on CD90.1+ cells). (C) GFP or dexOVA staining versus TCRβ expression (gated on CD90.1+CD8+ cells). (D and E) KO of the endogenous TCR dramatically improved dexOVA binding on OT-1 TCR-transduced CD8 cells. The resultant improvement in OT-1 TCR expression translated into better in vitro killing of B16-TMG cells. (F) Schematic representation of differences between TCX 1.0 and TCX 2.0 production. (G and H) T cell activation in TCX 1.0 is with anti-CD3/CD28 beads and IL-2, whereas in TCX 2.0, activation is with plate bound ant-CD3, IL-2, and soluble antibodies against CD28 and 41BB (gated on CD8+ cells); a higher percentage of TCX 2.0 CD8 cells were IL-7R+ and IL-7R+TCF-1+. (I–K) TCX 2.0 led to better dexOVA binding (I and J) and more viral integrations per cell (K). For G–K, each symbol represents data from a unique T cell product; data were compared using Mann-Whitney rank-sum tests.
Endogenous TCR deletion proved critical for optimal transduced TCR expression. Despite 68% transduction of CD8 cells based on GFP expression, without endogenous TCR editing, dexOVA binding was low (Figure 3C). However, with concomitant TCR KO, dexOVA binding was strong and correlated with overall TCRβ expression (Figure 3C). This improvement in OT-1 TCR expression had functional consequences because TCR-edited and TCR-transduced cells had similar killing as did activated OT-1 TCR transgenic cells, whereas there was less killing when cells were TCR transduced without editing (Figure 3, D and E).
Based on data suggesting that activation of T cells in vitro with anti-41BB agonist antibodies improves their metabolic fitness (42), we incorporated anti-41BB into a second manufacturing approach, wherein we stimulated T cells with plate-bound anti-CD3 and soluble antibodies against CD28 and 41BB, along with IL-2 (TCX 2.0; Figure 3F). The resultant product had a higher frequency of cells expressing IL-7Rα (CD127) and TCF-1 (Figure 3, G and H), which are predictive of better performance (43–47). TCX 2.0 also resulted in improved TCRβ expression and dexOVA binding (Figure 3, I and J). This could have been driven by more retroviral integrations per cell (Figure 3K).
We next tested TCX 1.0 and TCX 2.0 products in T cell immunotherapy of B16-TMG melanoma (Figure 4A). Mice were injected intradermally with B16-TMG cells. When tumors were 2 mm or larger in diameter, mice received total body irradiation (500 cGy) prior to the infusion of 2 × 10⁶ OT-1 TCR-transduced dexOVA+ CD8 cells created by TCX 1.0 or TCX 2.0. Though there was variability across experiments, products were 60%–80% CD8+ with 40%–70% dexOVA+. Control animals received T cells that underwent CRISPR editing without TCR transduction, adjusted to equal the number of cells in the OT-1 products that were not CD8+dexOVA+. In this way, we compared the efficacy of the TCR-transduced CD8 cells to the contaminating other T cells in the product. The following day, mice were injected i.p. with the agonist anti-CD40 antibody FGK45 as an adjuvant (48, 49), and tumor volumes were followed. Both TCX 1.0 and TCX 2.0 products controlled B16-MG growth (Figure 4, B–D). There was a trend for TCX 2.0 resulting in greater tumor regression relative to TCX 1.0 (Figure 4D; P = 0.09).
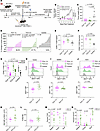 Figure 4
Treatment of B16-TMG melanoma with TCX 1.0 and TCX 2.0 products. (A) Treatment schema. B6 CD90.2 mice were injected intradermally with B16-TMG cells on day –13. On day 0, mice with tumors greater than 2 mm received total-body irradiation and CD90.1 TCX 1.0, TCX 2.0, or negative control cells, followed on day 1 with anti-CD40. Tumor size was followed and measured; mice were euthanized by day 18. (B and C) Both TCX 1.0 and TCX 2.0 cells reduced tumor volume (B) and weight (C). (D) Waterfall plots of change in tumor size from 3 independent experiments combined; mice that died prior to the end of the experiments were censured (see Supplemental Figure 8A). (E and F) TCX 2.0 CD8 cells were more numerous than TCX 1.0 and control cells in spleen (E), whereas there were similar numbers of each recovered from tumor, both greater than control cells (F). (G) More transferred TCX 1.0, TCX 2.0, and control cells were found in the draining LNs (DLNs) than in nondraining cervical lymph nodes (CLNs). (H–J) DexOVA MFIs of TCX 1.0 and 2.0 cells were similar in the spleen and DLNs but were greater in tumor-resident TCX 2.0 cells (top panels representative staining; lower panels MFIs from individual mice). (K and L) The dexOVA MFIs were higher among dexOVA+ TCX intratumor TCX2.0 cells (K) perhaps due to higher TCRβ expression (L). (M and N) A greater percentage of TCX1.0 cells were TOX+ in spleen and tumor (M), whereas a greater fraction of TCX 2.0 cells were CD127+ in spleen and DLN (N). Data in B and C are from 1 of 3 experiments with similar results. Differences between groups in B were calculated by determining the AUC of tumor volume versus posttreatment day data for each mouse at the end of the experiment and comparing the groups by ANOVA with Tukey’s post hoc test. P values in C were calculated using a Mann-Whitney rank-sum test. Data in D–N are combined from 3 independent experiments, and groups were compared using a Fisher’s exact test. Significance of cell numbers or MFIs in E–N were determined with Mann-Whitney rank-sum tests.
At euthanization, there were more splenic CD8+ TCX 2.0 cells than either control or TCX 1.0 cells (Figure 4E and Supplemental Figure 8B). Intratumoral TCX 2.0 and TCX 1.0 CD8 cells were similar in number and more numerous than control cells (Figure 4F and Supplemental Figure 8C). The numbers of TCX 1.0, TCX 2.0, and control CD8 cells in draining and nondraining cervical lymph nodes (LNs) were also similar, with trends toward more TCX 2.0 cells (Figure 4G). However, the dexOVA MFI of TCX 2.0 CD8 cells was higher than that of TCX 1.0 cells in the tumor but not in the spleen or draining LNs (Figure 4, H–J). Among dexOVA+ CD8 cells, the dexOVA MFI was also higher in TCX 2.0 cells (Figure 4K), consistent with a higher TCRβ MFI (Figure 4L). Taken together, these data suggest that in locations bereft of antigen (spleen and LN), TCX 2.0 cells were advantaged, perhaps because a greater fraction expressed CD127 (IL-7Rα) (Figure 4N and Supplemental Figure 8, B and C). Conversely, in the tumor where antigen was available, there could have been selection for cells with higher TCR expression as generated by the TCX 2.0 process (Figure 4J). Compared with TCX2.0 cells, TOX expression was higher among TCX 1.0 cells in tumor and spleen (Figure 4M and Supplemental Figure 8, B and C); this could reflect TCX 1.0 cells having more sustained antigen exposure, consistent with the trend for TCX 1.0 cells less effectively controlling tumor growth (Figure 4D).
Deeper characterization of anti-neoantigen TCRs.
To select TCRs for immunotherapy against MC38 tumors, we characterized several TCRs in depth. TCRs vary in surface expression (50) and affinity for peptide/MHCI complexes. To assess surface expression of Rpl18mut-specific TCRs, we transduced CD8+CD3+TCR-negative 4G4R thymoma cells with graded concentrations of retrovirus encoding the anti-Rpl18mut TCRs A09, I20, and I02 and plotted TCRβ MFIs versus the percentages of transduced cells (Figure 5, A and B). At equivalent transduction levels, I02 had the highest TCRβ expression (Figure 5B). At similar transduction percentages (Figure 4B), A09 bound dexRpl18 the most avidly (Figure 5, C and D).
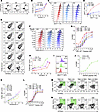 Figure 5
Characterization of anti-neoantigen TCRs. (A–D) mCherry-expressing retrovirus encoding the anti-Rpl18mut TCRs A09, I20, and I02 were used to infect 4G4R cells over a range of MOIs, and TCRβ expression Rpl18mut -dextramer binding were quantitated. (A) Representative flow. (B) Plot of percentage of mCherry+ versus TCRβ MFI of mCherry+ cells; each transduction was done in triplicate. (C and D) At a matched transduction (see red box in B), dexRpl18 binding over a range of concentrations was determined. (E) To test functionality, Jurkat reporter cells were transduced with TCRs A09, I20, C05, B22, H03, F05, H17, and J12 and puromycin-selected. (F and G) These lines were cultured with different concentrations of Rpl18mut peptide-pulsed B6WT3 cells (in triplicate) and the percentages that were CD69+ were determined. (F) Representative flow for TCRs A09, I20 and I02. (G) Peptide concentration/response plots for all TCRs. (H and I) Retrovirus encoding anti-ADPGK TCRs A10 and TCR30 and control anti-Rpl18 TCR A09 were used in dilution to infect 4G4R cells (in triplicate). Shown are TCRβ expression of mCherry+ cells (H) and dexADPGK staining of mCherry+ cells at about a 10% transduction (red box in H and I). (J) TCR A10-expressing Jurkat cells were cocultured with mutant or WT ADPGK peptide-pulsed B6WT3 cells (in triplicate) and the percentages of CD69+ cells were determined. (K) 4G4R cells were retrovirally transduced with anti-Zc3H7b TCRs over a range of MOIs in triplicate, and TCRβ MFIs were determined (of TCRβ+ cells). (L) Jurkat cells transduced with anti-Zc3H7b TCRs were reacted with B6WT3 cells pulsed with different concentrations of Zc3H7b-mutant peptide, and the percentages of CD69+ cells were determined. (M) Anti-PSMD2mut G13 TCR-transduced Jurkat cells were cocultured with B6WT3 cells transduced with PSMD2mut-encoding TMG 3.9 and 3.23 or versions reverted (REV) to express the WT PSMD2-derived peptide (PSMD2WT). (N) Anti-PSMD2mut G13 and A09 anti-Rpl18mut TCR-expressing Jurkat cells were reacted against MC38-Leiden cells and MC38-Kerafast cells, which lack the targeted Rpl18 and PSMD2 mutant peptides.
To test how these 2 properties combine to influence TCR signaling, we transduced Jurkat reporters with VSV-G–pseudotyped retrovirus encoding A09, I20, or I02 TCRs (Figure 5E). When cocultured with B6WT3 cells pulsed with different Rpl18mut peptide concentrations (Figure 5, F and G), their responsiveness varied over a wide range, with A09 being the most sensitive followed by I20 and I02. We similarly assessed the EC50 of additional anti-Rpl18mut TCRs (Figure 5G).
Given that we only cloned 1 anti-ADPGK TCR (A10), we compared it with a published anti-ADPGK TCR that we synthesized and cloned into our expression vector (TCR30; ref. 51) and to the anti-Rpl18 TCR A09. At matched transduction percentages, A10 had higher TCR expression than did TCR30 or A09; nonetheless TCR30 bound dexADPGK more avidly than did A10 (Figure 5, H and I). Despite weak dexADPGK binding, a Jurkat line expressing A10 upregulated CD69 when cocultured with B6WT3 cells pulsed with ADPGKmut but not WT ADPGK peptide (Figure 5J).
We similarly analyzed a subset of the anti-Zc3h7b TCRs in 4G4R cells. At matched transduction percentages, TCRs F02, E09, D10, E17, and F02 had comparable TCRβ MFIs, all higher than that of TCR B06 (Figure 5K). When a broader panel of anti-Zc3h7b TCRs was expressed in Jurkat cells and cocultured with Zc3H7b-mutant peptide pulsed B6WT3 cells, we observed a wide range of EC50 values (Figure 5L). Reactivity was limited to the mutant peptide in all cases (Supplemental Figure 9).
The anti-PSMD2 TCR G13 was likewise specific for the mutant epitope as it did not react with TMGs 3.9 and 3.23 that were reverted to express WT PSMD2 (Figure 5M). We also obtained the Kerafast MC38 line (MC38K), which exome sequencing revealed to lack the Psmd2 and Rpl18 mutations (52). Consistent with this, the anti-Rpl18mut A09 and the anti-PSMD2mut G13 TCR-Jurkat lines only reacted against MC38-Leiden cells (Figure 5N).
Killing by anti-neoantigen–TCR-transduced T cell products.
We next made TCX 2.0 TCR products and tested their ability to kill: B6WT3 cells pulsed with peptide targets, B6WT3 cells transduced with cassettes that drive expression of these epitopes, and MC38 cells. Anti-Rpl18mut products expressing TCRs A09, I20, and I02 TCRs did not kill B6WT3 cells or Rpl18WT-pulsed B6WT3 cells but did kill Rpl18mut-pulsed B6WT3 cells (Figure 6, A–D). Anti-Rpl18mut T cells also killed B6WT3 cells transduced with a cassette expressing the Rpl18mut and H60 epitopes, as did an anti-H60 TCR product (Figure 6E). Importantly, all tested anti-Rpl18mut products killed MC38 cells to a greater degree compared with a control OT-1 TCR product (Figure 6F).
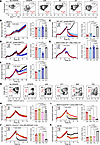 Figure 6
Anti-neoantigen TCR-transduced primary T cells kill neoantigen-expressing targets in vitro. (A–F) Primary T cell products expressing anti-Rpl18mut TCRs A09, I20, I02, the anti-OVA TCR OT-1, and an anti-H60 TCR were generated using TCX 2.0. These products were assessed by flow cytometry and in vitro cytotoxicity assays. (A) DexRpl18 binding and TCRβ expression, gated on CD8+ cells. Killing of (B) B6WT3, (C) Rpl18mut-pulsed B6WT3, (D) Rpl18WT-pulsed B6WT3, (E) B6WT3 cells transduced with a minigene construct expressing Rpl18mut and H60 (F) and MC38 cells. (G–K) Primary T cell products expressing the anti-Zc3h7bmut TCRs B06 and F02, the anti-Rpl18mut TCR A09, and the anti-OVA TCR OT-1 were generated using TCX2.0 and analyzed by flow cytometry (G) and in killing assays against (H) B6WT3 cells, (I) B6WT3 cells transduced with minigenes expressing OVA and Zc3h7bmut, or (J) OVA and Zc3h7bWT, or (K) unmanipulated MC38 cells. Significance was calculated comparing the AUCs for each condition using 1-way ANOVA followed by Tukey’s post hoc or Dunnett’s multiple-comparison test.
Anti-Zc3h7bmut products (Figure 6G) killed B6WT3 cells transduced with a cassette that expresses Zc3h7bmut and OVA (Figure 6H). This killing was more effective compared with an anti-Rpl18mut product and similar to positive control OT-1–transduced cells (Figure 6I). Killing was specific for the mutant epitope, as there was not killing of targets transduced with a Zc3h7bWT/OVA cassette (Figure 6J). Finally, these anti-Zc3h7bmut T cells killed MC38 cells, as did anti-Rpl18mut T cells (Figure 6K). We also tested the functionality of the anti-ADPGKmut A10 and TCR30 TCRs. We made primary T cell products with TCRs A10, TCR30, the anti-Rpl18mut TCR A09, and an anti-SIINFEKL TCR that we cloned (TCR M19). TCR30 cells, and to a lesser extent A10 cells, bound dexADPGK (Supplemental Figure 10A); only A09-transduced CD8 cells bound dexRpl18. A10, TCR30, and A09 products killed MC38 cells, though A10 killing was relatively weak, consistent with low dexADPGK binding (Supplemental Figure 10B). M19 and A09 products killed OVA- or OVA-Rpl18 TMG-expressing B6WT3 cells (respectively) whereas A10 and TCR30 cells did not (Supplemental Figure 10, C and D). Reciprocally, A10, TCR30, and M19 T cells killed B6WT3 cells expressing ADPGKmut and OVA, whereas control A09 cells did not (Supplemental Figure 10E). All products had similar effects on untransduced B6WT3 cells (Supplemental Figure 10F). In summary, anti-neoantigen TCRs cloned from TILs redirected primary T cells to kill targets, including MC38 cells, with specificity for the mutant variants.
Treatment of MC38 tumors with anti-Rpl18mut T cells.
CD90.2+ B6 mice in which the site of MC38 tumor cell injection was greater than 2 mm were sublethally irradiated and infused with B6 CD90.1 TCX 2.0 products expressing anti-Rpl18mut TCRs A09 or I20 or, as a control, the OT-1 TCR. The following day, mice received anti-CD40 as an adjuvant (Figure 7A). Treatment with either I20 or A09 T cells inhibited tumor growth relative to OT-1 cells (Figure 7, B–D, and Supplemental Figure 11A). At euthanization, A09, I20, and OT-1 CD8+ T cell numbers were similar in the spleen, draining and contralateral LNs, and tumor bed (Figure 7, E–G, and Supplemental Figure 11). The dexRpl18 MFI on A09 cells was greater than that on I20 cells (Figure 7, H–J), consistent with their properties in reporter cells (Figure 5, C and D) and in the pre-transfer T cell products (Figure 6A). Taken together, these experiments validate our TCR cloning and target-matching processes, in that TCRs cloned from TILs redirected primary T cells into functional therapeutics.
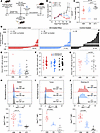 Figure 7
Treatment of MC38 tumors with anti-Rpl18 TCR-transduced T cells. (A) Experimental design. MC38 cells were implanted intradermally into CD90.2 B6 mice. Nine days later, mice with tumors more than 2 mm in diameter were sublethally irradiated and injected with CD90.1 TCX 2.0 products transduced with anti-Rpl18mut TCRs A09 or I20 or with the OT-1 TCR, followed by anti-CD40 on day 1. Both A09 and I20 products reduced tumor volumes (B) and the weight of the residual tumor (C) (significant only for A09; data in B and C from 1 representative experiment). The lowest values in C were too small to be reliably weighed and were assigned arbitrary values. (D) Waterfall plots of change in tumor volume from 3 experiments combined. (E and F) Similar numbers of CD8 cells from the 3 products were recovered from the spleen and draining and contralateral LNs. (G) More I20 cells/mg tumor were recovered from the residual tumor bed; only tumors with at least 25 donor CD8 cells were included. (H–J) DexRpl18 binding on A09 cells was greater than I02 in tumor and draining LNs (I and J) but not spleen (H). Changes in tumor volume were compared by calculating the AUC for the tumor volume over time and comparing those values using a Kruskal-Wallis test followed by a Dunn’s multiple-comparison post hoc test. Tumor weights were compared by Mann-Whitney rank-sum tests. The number of regressed tumors among groups was compared using a Fisher’s exact test. All other values were compared using Mann-Whitney rank-sum tests.


