
Research ArticleInflammationMetabolismNephrology
Open Access |  10.1172/jci.insight.200841
Longitudinal multiorgan transcriptomic atlas of salt-induced hypertension
Ratnakar Tiwari,1 Olha Kravtsova,1 Lashodya V. Dissanayake,1 Melissa Lowe,1 Biyang Xu,1 Vladislav Levchenko,1 Steven Didik,1 Ruslan Bohovyk,1 Daria V. Ilatovskaya,2 Oleg Palygin,3 and Alexander Staruschenko1,4,5
1Department of Molecular Pharmacology and Physiology, University of South Florida, Tampa, Florida, USA.
2Department of Physiology, Medical College of Georgia, Augusta University, Augusta, Georgia, USA.
3Department of Medicine, Division of Nephrology, Medical University of South Carolina, Charleston, South Carolina, USA.
4Hypertension and Kidney Research Center, University of South Florida, Tampa, Florida, USA.
5James A. Haley Veterans’ Hospital, Tampa, Florida, USA.
Address correspondence to: Ratnakar Tiwari or Alexander Staruschenko, Department of Molecular Pharmacology and Physiology, University of South Florida, 560 Channelside Dr., Tampa, Florida, 33602, USA. Phone: 913.206.0264; Email: rtiwari@usf.edu (RT). Phone: 813.396.0147; Email: staruschenko@usf.edu (AS).
Find articles by Tiwari, R. in: PubMed | Google Scholar
1Department of Molecular Pharmacology and Physiology, University of South Florida, Tampa, Florida, USA.
2Department of Physiology, Medical College of Georgia, Augusta University, Augusta, Georgia, USA.
3Department of Medicine, Division of Nephrology, Medical University of South Carolina, Charleston, South Carolina, USA.
4Hypertension and Kidney Research Center, University of South Florida, Tampa, Florida, USA.
5James A. Haley Veterans’ Hospital, Tampa, Florida, USA.
Address correspondence to: Ratnakar Tiwari or Alexander Staruschenko, Department of Molecular Pharmacology and Physiology, University of South Florida, 560 Channelside Dr., Tampa, Florida, 33602, USA. Phone: 913.206.0264; Email: rtiwari@usf.edu (RT). Phone: 813.396.0147; Email: staruschenko@usf.edu (AS).
Find articles by Kravtsova, O. in: PubMed | Google Scholar
1Department of Molecular Pharmacology and Physiology, University of South Florida, Tampa, Florida, USA.
2Department of Physiology, Medical College of Georgia, Augusta University, Augusta, Georgia, USA.
3Department of Medicine, Division of Nephrology, Medical University of South Carolina, Charleston, South Carolina, USA.
4Hypertension and Kidney Research Center, University of South Florida, Tampa, Florida, USA.
5James A. Haley Veterans’ Hospital, Tampa, Florida, USA.
Address correspondence to: Ratnakar Tiwari or Alexander Staruschenko, Department of Molecular Pharmacology and Physiology, University of South Florida, 560 Channelside Dr., Tampa, Florida, 33602, USA. Phone: 913.206.0264; Email: rtiwari@usf.edu (RT). Phone: 813.396.0147; Email: staruschenko@usf.edu (AS).
Find articles by
Dissanayake, L.
in:
PubMed
|
Google Scholar
|

1Department of Molecular Pharmacology and Physiology, University of South Florida, Tampa, Florida, USA.
2Department of Physiology, Medical College of Georgia, Augusta University, Augusta, Georgia, USA.
3Department of Medicine, Division of Nephrology, Medical University of South Carolina, Charleston, South Carolina, USA.
4Hypertension and Kidney Research Center, University of South Florida, Tampa, Florida, USA.
5James A. Haley Veterans’ Hospital, Tampa, Florida, USA.
Address correspondence to: Ratnakar Tiwari or Alexander Staruschenko, Department of Molecular Pharmacology and Physiology, University of South Florida, 560 Channelside Dr., Tampa, Florida, 33602, USA. Phone: 913.206.0264; Email: rtiwari@usf.edu (RT). Phone: 813.396.0147; Email: staruschenko@usf.edu (AS).
Find articles by Lowe, M. in: PubMed | Google Scholar
1Department of Molecular Pharmacology and Physiology, University of South Florida, Tampa, Florida, USA.
2Department of Physiology, Medical College of Georgia, Augusta University, Augusta, Georgia, USA.
3Department of Medicine, Division of Nephrology, Medical University of South Carolina, Charleston, South Carolina, USA.
4Hypertension and Kidney Research Center, University of South Florida, Tampa, Florida, USA.
5James A. Haley Veterans’ Hospital, Tampa, Florida, USA.
Address correspondence to: Ratnakar Tiwari or Alexander Staruschenko, Department of Molecular Pharmacology and Physiology, University of South Florida, 560 Channelside Dr., Tampa, Florida, 33602, USA. Phone: 913.206.0264; Email: rtiwari@usf.edu (RT). Phone: 813.396.0147; Email: staruschenko@usf.edu (AS).
Find articles by Xu, B. in: PubMed | Google Scholar
1Department of Molecular Pharmacology and Physiology, University of South Florida, Tampa, Florida, USA.
2Department of Physiology, Medical College of Georgia, Augusta University, Augusta, Georgia, USA.
3Department of Medicine, Division of Nephrology, Medical University of South Carolina, Charleston, South Carolina, USA.
4Hypertension and Kidney Research Center, University of South Florida, Tampa, Florida, USA.
5James A. Haley Veterans’ Hospital, Tampa, Florida, USA.
Address correspondence to: Ratnakar Tiwari or Alexander Staruschenko, Department of Molecular Pharmacology and Physiology, University of South Florida, 560 Channelside Dr., Tampa, Florida, 33602, USA. Phone: 913.206.0264; Email: rtiwari@usf.edu (RT). Phone: 813.396.0147; Email: staruschenko@usf.edu (AS).
Find articles by Levchenko, V. in: PubMed | Google Scholar
1Department of Molecular Pharmacology and Physiology, University of South Florida, Tampa, Florida, USA.
2Department of Physiology, Medical College of Georgia, Augusta University, Augusta, Georgia, USA.
3Department of Medicine, Division of Nephrology, Medical University of South Carolina, Charleston, South Carolina, USA.
4Hypertension and Kidney Research Center, University of South Florida, Tampa, Florida, USA.
5James A. Haley Veterans’ Hospital, Tampa, Florida, USA.
Address correspondence to: Ratnakar Tiwari or Alexander Staruschenko, Department of Molecular Pharmacology and Physiology, University of South Florida, 560 Channelside Dr., Tampa, Florida, 33602, USA. Phone: 913.206.0264; Email: rtiwari@usf.edu (RT). Phone: 813.396.0147; Email: staruschenko@usf.edu (AS).
Find articles by Didik, S. in: PubMed | Google Scholar
1Department of Molecular Pharmacology and Physiology, University of South Florida, Tampa, Florida, USA.
2Department of Physiology, Medical College of Georgia, Augusta University, Augusta, Georgia, USA.
3Department of Medicine, Division of Nephrology, Medical University of South Carolina, Charleston, South Carolina, USA.
4Hypertension and Kidney Research Center, University of South Florida, Tampa, Florida, USA.
5James A. Haley Veterans’ Hospital, Tampa, Florida, USA.
Address correspondence to: Ratnakar Tiwari or Alexander Staruschenko, Department of Molecular Pharmacology and Physiology, University of South Florida, 560 Channelside Dr., Tampa, Florida, 33602, USA. Phone: 913.206.0264; Email: rtiwari@usf.edu (RT). Phone: 813.396.0147; Email: staruschenko@usf.edu (AS).
Find articles by Bohovyk, R. in: PubMed | Google Scholar
1Department of Molecular Pharmacology and Physiology, University of South Florida, Tampa, Florida, USA.
2Department of Physiology, Medical College of Georgia, Augusta University, Augusta, Georgia, USA.
3Department of Medicine, Division of Nephrology, Medical University of South Carolina, Charleston, South Carolina, USA.
4Hypertension and Kidney Research Center, University of South Florida, Tampa, Florida, USA.
5James A. Haley Veterans’ Hospital, Tampa, Florida, USA.
Address correspondence to: Ratnakar Tiwari or Alexander Staruschenko, Department of Molecular Pharmacology and Physiology, University of South Florida, 560 Channelside Dr., Tampa, Florida, 33602, USA. Phone: 913.206.0264; Email: rtiwari@usf.edu (RT). Phone: 813.396.0147; Email: staruschenko@usf.edu (AS).
Find articles by
Ilatovskaya, D.
in:
PubMed
|
Google Scholar
|
1Department of Molecular Pharmacology and Physiology, University of South Florida, Tampa, Florida, USA.
2Department of Physiology, Medical College of Georgia, Augusta University, Augusta, Georgia, USA.
3Department of Medicine, Division of Nephrology, Medical University of South Carolina, Charleston, South Carolina, USA.
4Hypertension and Kidney Research Center, University of South Florida, Tampa, Florida, USA.
5James A. Haley Veterans’ Hospital, Tampa, Florida, USA.
Address correspondence to: Ratnakar Tiwari or Alexander Staruschenko, Department of Molecular Pharmacology and Physiology, University of South Florida, 560 Channelside Dr., Tampa, Florida, 33602, USA. Phone: 913.206.0264; Email: rtiwari@usf.edu (RT). Phone: 813.396.0147; Email: staruschenko@usf.edu (AS).
Find articles by Palygin, O. in: PubMed | Google Scholar
1Department of Molecular Pharmacology and Physiology, University of South Florida, Tampa, Florida, USA.
2Department of Physiology, Medical College of Georgia, Augusta University, Augusta, Georgia, USA.
3Department of Medicine, Division of Nephrology, Medical University of South Carolina, Charleston, South Carolina, USA.
4Hypertension and Kidney Research Center, University of South Florida, Tampa, Florida, USA.
5James A. Haley Veterans’ Hospital, Tampa, Florida, USA.
Address correspondence to: Ratnakar Tiwari or Alexander Staruschenko, Department of Molecular Pharmacology and Physiology, University of South Florida, 560 Channelside Dr., Tampa, Florida, 33602, USA. Phone: 913.206.0264; Email: rtiwari@usf.edu (RT). Phone: 813.396.0147; Email: staruschenko@usf.edu (AS).
Find articles by
Staruschenko, A.
in:
PubMed
|
Google Scholar
|
Published April 23, 2026 - More info
JCI Insight. 2026;11(12):e200841. https://doi.org/10.1172/jci.insight.200841.
© 2026 Tiwari et al. This work is licensed under the Creative Commons Attribution 4.0 International License. To view a copy of this license, visit http://creativecommons.org/licenses/by/4.0/.
Received: September 30, 2025; Accepted: April 21, 2026


-
Results
A longitudinal transcriptomic atlas of salt-induced hypertension. To systematically define the transcriptional landscape underlying salt-induced hypertensive injury, we performed mRNA-seq across 4 tissues: kidney cortex, kidney medulla, liver, and heart. Samples were collected from Dahl SS rats fed a HS (4% NaCl) diet at 4 progressive stages of hypertension (days 7, 14, 21, and 35), alongside a normal-salt (NS) diet–fed (0.4% NaCl) control group. This design spans the full course of disease progression, beginning with the onset of high blood pressure by day 7 (Supplemental Figure 1A; supplemental material available online with this article; https://doi.org/10.1172/jci.insight.200841DS1), through to late-stage pathology, including the terminal phase at day 35 when animals start to exhibit advanced cardiovascular dysfunction leading to stroke and death. In total, the study yields 120 high-quality transcriptomes, providing a rich resource to decode the longitudinal multiorgan molecular dynamics of HS diet–induced hypertensive injury (Figure 1A).
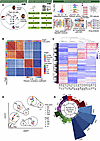 Figure 1
Overview of experimental design, data quality, and global transcriptional profiling. (A) Schematic of the study design and bioinformatics pipeline. Male Dahl SS rats were maintained on a normal-salt (NS) control diet or switched to a high-salt (HS) diet at 9–11 weeks of age to induce hypertension and organ injury. Kidney cortex, kidney medulla, liver, and heart samples were collected from NS controls and HS-fed rats after 7, 14, 21, and 35 days of treatment. RNA was isolated, quality-checked, and sequenced. Reads underwent sample-level quality control, alignment, and quantification. Downstream analyses included variance-stabilizing transformation (VST), differential expression analysis, pathway and upstream regulator enrichment, protein-protein interaction network analysis, genome-wide association study (GWAS) integration, and drug target analyses. (B) Sample-sample Pearson correlation heatmap, annotated by organ and time point. (C) Heatmap of all significantly differentially expressed genes (Padj < 0.05), hierarchically clustered by sample (columns) and gene (rows). Red boxes highlight major coexpression gene modules segregating primarily by organ. (D) UMAP embedding of all 120 samples using VST counts, showing predominant clustering by organ. Dashed circles highlight zoomed-in views of distinct tissue clusters, illustrating separation of NS from HS experimental groups. (E) Radial bar chart summarizing the number of differentially expressed genes (|log2 fold change| ≥ 0.585, equivalent to a fold change ≥ 1.5, Padj < 0.05) in each tissue and time point, illustrating dynamic and tissue-specific transcriptional responses to HS-induced hypertension. CX, cortex; MD, medulla; LV, liver; HR, heart; D7, day 7; D14, day 14; D21, day 21; and D35, day 35 time points. n = 6 male rats per group.
Principal component analysis (PCA) revealed strong segregation by organ identity (Supplemental Figure 1B), while rank-abundance plots confirm stable expression distributions across tissues and time points (Supplemental Figure 1C). Sample-sample Pearson correlation (Figure 1B and Supplemental Data Sheet 1) and hierarchical clustering of all genes (Padj < 0.05) partitioned samples into well-defined blocks corresponding to organ (Figure 1C). In uniform manifold approximation and projection (UMAP) analysis, distinct organ-specific clusters also showed separation between control (NS) and hypertensive conditions (Figure 1D).
Next, we performed differential expression analysis, comparing the tissue samples with their corresponding NS control tissues. Applying a threshold of Padj value less than 0.05 and absolute log2 fold change greater than or equal to 0.585 (corresponding to absolute fold change ≥ 1.5), we identified a substantial number of differentially expressed genes (DEGs) across the datasets (Supplemental Figure 2). We found a dynamic transcriptional pattern with an early elevation in DEGs, a midstage decline, and a subsequent rise at the later stage of HS diet–induced hypertensive injury (Figure 1E). Notably, the kidney medulla exhibited greater magnitude changes than the other tissues, with the number of DEGs increasing sharply from 2,369 on day 7 to 3,262 on day 14, decreasing to 2,977 on day 21, and peaking at 4,003 by day 35. A similar pattern was detected for the liver. However, for the kidney cortex and heart, the number of DEGs showed transient suppression of initial response earlier, on day 14, with following reactivation also peaking by day 35. These phased trajectories suggest differential responses across tissues, with the kidney medulla exhibiting the strongest transcriptional remodeling, consistent with its complex role in pressure-natriuresis and tubular transport within a relatively low-oxygen environment that increases susceptibility to injury.
To better understand the physiological context of these transcriptional changes, we next examined systemic electrolyte balance and injury (Supplemental Figures 3 and 4). The HS diet groups showed a marked increase in sodium and chloride excretion and a marked increase in blood pH, indicating a systemic change in acid-base homeostasis (Supplemental Figure 3). Furthermore, we observed an increase in relative kidney weight, a marked diuresis, and a progressive rise in urinary albumin excretion, which peaked at day 21 before partially declining by day 35 (Supplemental Figure 4). Notably, serum creatinine levels became significantly elevated only at the late stage, on day 35. Histology in the liver, heart, and kidney showed progressive injury and fibrosis, consistent with the transcriptomic signatures (Supplemental Figures 3 and 4).
Collectively, this atlas defines the dynamic transcriptomic, cellular, and functional landscape of HS diet–induced hypertensive injury.
Salt-induced hypertension drives dynamic and tissue-specific reprogramming of core biological pathways. To identify coordinated molecular responses in HS diet–induced hypertensive injury, we quantified the activity of 50 Hallmark pathways in different tissues over time. This analysis revealed coordinated activation and repression of canonical pathways with disease progression (Figure 2A and Supplemental Figure 5). As noted above, the kidney medulla exhibited the most robust and sustained changes in gene diversity and pathway activity. By day 7, inflammatory pathways were strongly upregulated and remained elevated across all subsequent time points. In parallel, proliferative and stress-adaptive programs were also activated early and sustained. In contrast, metabolic pathways were markedly suppressed at day 7 and remained inhibited as compared with the NS control medulla group. Developmental programs such as angiogenesis and epithelial-mesenchymal transition (EMT) were persistently elevated, suggesting continuous tissue remodeling responses. However, the kidney cortex showed a comparatively moderate response. Metabolic programs such as oxidative phosphorylation were slightly induced on day 7, followed by a decline over time. Inflammatory pathways were gradually upregulated, reaching peak activity at later time points. Stress pathways such as hypoxia followed a similar pattern, with late-stage elevation. Structural remodeling pathways (angiogenesis, EMT) also followed a delayed activation trajectory.
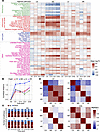 Figure 2
High-salt diet–induced hypertension dynamically regulates biological pathway activity across organs. (A) Mean pathway activity heatmap of 50 Hallmark pathways across cortex, medulla, heart, and liver at days 7, 14, 21, and 35 after initiation of a high-salt (HS) diet compared with normal-salt (NS) controls. Pathways are highlighted as functional groups, including metabolism, inflammation and death, cell cycle, and other clustered along the y axis. (B) Euclidean distances from baseline pathway profiles plotted over time, representing the magnitude of transcriptomic remodeling in each organ. The medulla shows the greatest divergence, followed by the heart, cortex, and liver. (C) Stacked bar charts enumerating upregulated (red) and downregulated (blue) Hallmark pathways at each time point for each organ. Numeric labels indicate pathway counts, highlighting distinct kinetics of pathway engagement across tissues. (D) Heatmaps showing Pearson correlation between pathway profiles across tissues (cortex, medulla, heart, and liver) at each time point (days 7, 14, 21, and 35). Each panel compares all organ pairs for a single time point, revealing similarities and differences in pathway responses among organs after the HS diet. CX, cortex; MD, medulla; LV, liver; HR, heart; D7, day 7; D14, day 14; D21, day 21; and D35, day 35 time points. n = 6 male rats per group.
In the liver, several metabolic programs—including glycolysis, cholesterol homeostasis, and heme metabolism—together with proliferative pathways such as E2F targets and the G2M checkpoint were upregulated as early as day 7. Immune and inflammatory pathways also showed persistent activation, although at a lower magnitude than in the kidney. The heart exhibited modest activation of selected immune and stress-related pathways at day 7, followed by a transient attenuation at day 14. By day 21, a second wave of pathway activity emerged, marked by the induction of inflammation-related pathways (allograft rejection, IL-2/STAT5, IL-6/JAK/STAT3), metabolic programs (cholesterol homeostasis), and structural remodeling signals (angiogenesis and EMT).
To quantify how far each tissue’s global pathway profile deviated from its baseline state, we calculated Euclidean distances (Figure 2B). This confirmed the medulla’s early and sustained divergence, while the cortex, liver, and heart followed more gradual trajectories with moderate changes. To assess the directionality of biological pathway regulation over time, we quantified the number of upregulated and downregulated Hallmark pathways in each tissue (Figure 2C). This analysis revealed that the renal cortex exhibited a progressive shift toward increased pathway activation, with an early rise in upregulated pathways accompanied by a sustained decline in downregulated pathways. The medulla showed a consistent pattern over time, with relatively stable numbers of both up- and downregulated pathways. The liver demonstrated predominantly upregulated pathways with minimal evidence of repression, indicating sustained transcriptional activation. In contrast, the heart displayed a dynamic response, characterized by early activation, a transient reduction in upregulated pathways at the intermediate time point, and renewed activation at later stages.
To better understand whether different organs follow similar or distinct patterns of biological pathway activities during the progression of hypertensive injury, we calculated Pearson correlations using activity scores of 50 Hallmark pathways at each time point (Figure 2D and Supplemental Data Sheet 2). Notably, until day 14, the kidney medulla and cortex exhibited no significant correlation in pathway activity (D7: r2 = 0.04, P = 0.14; D14: r2 = 0.02, P = 0.28), suggesting distinct molecular responses despite their anatomical proximity. Interestingly, the medulla showed some similarity in pathway responses on day 7 with extrarenal tissues, showing significant correlations with the liver (D7: r2 = 0.60, P < 0.0001) and heart (r2 = 0.57, P < 0.0001), which dropped on day 14 (liver: r2 = 0.35, P < 0.0001; heart: r2 = 0.18, P < 0.01). On day 21, the medulla and cortex started showing similarities in pathway activity (r2 = 0.3, P < 0.0001), while the similarities in pathway activity between the medulla and the liver or heart dropped (Supplemental Data Sheet 2). On day 35, the similarities in pathway activities increased again, with the medulla showing significant correlations with cortex (r2 = 0.53, P < 0.0001), liver (r2 = 0.37, P < 0.0001), and heart (r2 = 0.62, P < 0.0001). Overall, this analysis indicates that, in the early stages of HS diet–induced hypertensive injury, tissues engage distinct biological pathway responses, with the medulla aligning more with extrarenal tissues than with the adjacent cortex. Over time, biological pathway dynamics converged across tissues, reflecting progression to a systemic state of chronic injury.
Next, we applied UMAP dimensionality reduction to the Hallmark pathway activity matrix (Supplemental Figure 6) to group pathways based on similarity in temporal dynamics, independent of absolute expression levels or tissue origin. The resulting modules captured coherent biological themes, including mitochondrial and lipid metabolism, immune and inflammatory signaling, cell cycle progression, and stress adaptation. The distinct spatial separation and tight grouping of clusters reflected coordinated engagement of different biological programs during HS diet–induced hypertensive injury, indicating synchronized activation of metabolic, inflammatory, and remodeling processes throughout disease progression.
In summary, these analyses demonstrate that HS diet induces distinct tissue-specific remodeling in the kidney, heart, and liver, while also engaging a subset of pathways that exhibit cross-organ involvement, suggesting partial convergence of molecular responses during disease progression.
Shared molecular signatures uncover early cell cycle activation and late immune remodeling across organs. To uncover conserved transcriptional programs in HS diet–induced hypertensive injury across tissues, we identified common genes that were significantly differentially expressed in all 4 tissues and may represent global targets at each time point of the disease progression. Venn analysis revealed a dynamic change of organ-specific and shared responses (Figure 3A). The early transcriptional response at day 7 showed a set of 44 genes common to all tissues. This shared signature decreased at days 14 and 21, but a distinct set of 33 overlapping genes reappeared at day 35. Heatmaps of these common DEGs demonstrated consistent expression patterns across organs within each time point (Figure 3, B and F–H). Analysis of the D7 common genes using Hallmark and Gene Ontology Biological Process (GO-BP) revealed a focused cell cycle program, including G2M checkpoint, E2F targets, and mitotic spindle terms (Figure 3C, Supplemental Figure 7A, and Supplemental Data Sheet 3). These were further supported by semantic similarity–based network analysis, which grouped top GO-BP terms into connected modules (Supplemental Figure 7B).
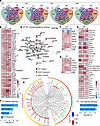 Figure 3
Shared transcriptional and pathway programs across organs in response to high-salt diet–induced hypertension. (A) Venn diagrams show overlap of DEGs across cortex, medulla, liver, and heart at each time point (days 7, 14, 21, and 35). Each segment displays the number of unique and shared DEGs. Genes shared by all tissues are highlighted in the center. (B) Heatmap of 44 common DEGs across all tissues on day 7. (C) Bar plot showing significant Hallmark pathways emerged in the analysis of day 7 common genes. (D) STRING-derived protein-protein interaction (PPI) network of common day 7 genes, with modules annotated by top enriched Hallmark terms per Louvain clustering. (E) Circos plot showing high-confidence TF–target interactions for day 7 common genes, where outer sectors represent TFs and targets, colored by average log2FC. Directional links denote regulatory interactions. (F–H) Heatmaps of common DEGs at days 14, 21, and 35. (I) Hallmark pathways emerged for D35 common genes. CX, cortex; MD, medulla; LV, liver; HR, heart; D7, day 7; D14, day 14; D21, day 21; and D35, day 35 time points. Padj indicates Padj value. n = 6 male rats per group.
To examine the organizational architecture of identified global targets, we constructed protein-protein interaction (PPI) networks using STRING (23). PPI analysis on the D7 common genes formed a densely connected network, which resolved into distinct modules (Figure 3D), each enriched for canonical cell cycle processes. To further dissect regulatory architecture, we integrated high-confidence transcription factor–target (TF-target) interactions from the DoRothEA regulon (24) with day 7 common genes. This analysis revealed 18 TF genes, including forkhead box M1 (Foxm1), MYC proto-oncogene, bHLH TF (Myc), and E2F TF 3 (E2f3), which converged on 21 common DEGs (Figure 3E). Notably, several target genes, including cyclin A2 (Ccna2), DNA topoisomerase II α (Top2a), and cyclin-dependent kinase 1 (Cdk1), were coregulated by multiple TFs, underscoring a core network of transcriptional convergence tightly linked to mitotic control. In contrast, the shared gene program on day 35 displayed a stark shift in composition, with 33 common genes enriched for inflammatory and immunomodulatory mediators. The enrichment results at this time point indicated cytokine signaling IL-6/JAK/STAT3 and vascular remodeling pathways (Figure 3I and Supplemental Figure 7C). The GO-BP terms were more sparsely connected than on day 7, indicating a broader heterogeneity (Supplemental Figure 7D and Supplemental Data Sheet 3). Consistently, the day 35 PPI network did not resolve into a well-connected structure (data not shown), marking a diversified immunometabolic signature.
In summary, we identified conserved, time-dependent transcriptional programs in HS diet–induced hypertensive injury. An early proliferative response was shared across organs, whereas later stages featured a more heterogeneous immune and matrix remodeling signature.
Organ-unique transcriptional profiles reveal the complexity of salt-induced hypertensive injury. Beyond the global transcriptomic signatures, we next looked to more organ-specific gene remodeling. We identified organ-unique responder genes, defined as those differentially expressed in only a single tissue at any time point compared with their respective controls. This analysis revealed robust, tissue-specific transcriptomic changes (Figure 4A). The kidney medulla accounted for the largest number of organ-unique genes (3,645 genes), followed by the liver (935 genes), cortex (459 genes), and heart (438 genes), highlighting the medulla’s pronounced transcriptional responsiveness to HS diet intake (Supplemental Data Sheet 4). Next, we defined genes that remained differentially expressed across all 4 time points (day 7–35) within a single tissue (stable unique genes). This subset contained 673 genes, further dominated by the medulla (644 genes), with only limited representation in liver (14 genes), heart (11 genes), and cortex (4 genes) (Figure 4B and Supplemental Data Sheet 5). These genes represent persistent, tissue-specific responders to HS diet–induced hypertensive injury.
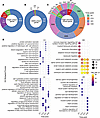 Figure 4
High-salt diet–induced hypertension drives distinct temporal and organ-specific transcriptional programs, revealing tissue-specific injury mechanisms. (A) Donut plot showing the number of DEGs that are unique to each tissue across any time point. (B) Subset of tissue-specific genes that are consistently differentially expressed across all 4 time points within a given tissue. (C) Nested donut chart illustrates the number of DEGs unique to each tissue and time point. Inner ring represents tissue, while the outer ring breaks them down by time point (days 7–35) and showing unique DEGs per tissue per time point. (D) Top 5 significantly enriched GO Biological Process (GO-BP) terms (Padj < 0.05) for time point– and organ-specific DEGs. Dot size reflects the number of genes per term, and color intensity indicates statistical significance. PI3K/PKB, phosphatidylinositol 3−kinase/protein kinase B; CX, cortex; MD, medulla; LV, liver; HR, heart; D7, day 7; D14, day 14; D21, day 21; and D35, day 35 time points. Padj indicates Padj value. n = 6 male rats per group.
Next, we identified organ- and time-unique genes, defined as genes that are differentially expressed in only 1 tissue at a single time point, regardless of their expression status at other stages (Figure 4C and Supplemental Data Sheet 6). To understand the biological effect of these dynamically regulated, organ- and time-specific gene sets, we performed GO-BP enrichment (Supplemental Data Sheet 7) and plotted the 5 most significantly (Padj < 0.05) enriched terms for each organ and time point (Figure 4D). While this focused view highlights the most prominent pathways at a specific time point, additional significantly enriched terms were detected (Supplemental Data Sheet 7). This analysis revealed that, in the kidney cortex at day 7, the top pathways were involved in organic and monocarboxylic acid transport. By day 21, top 5 GO-BP terms in the cortex shifted toward vascular and hemostatic regulation, with enrichment in pathways such as fibrinolysis, vasoconstriction, and proteolytic cascades. These features suggest the emergence of hemodynamic stress. The day 35 top 5 terms shifted toward developmental and immune differentiation, indicating late epithelial remodeling and immune engagement. Whereas in the kidney medulla, starting from day 7, enrichment was dominated by leukocyte activation and trafficking, indicating an early and robust inflammatory response. Terms related to catabolic and metabolic activities rose to the top 5 pathways at later time points in the medulla. While the immune-related pathways did not appear among the top 5 terms at later stages, they remained significantly enriched in the medulla throughout the time course of the study (Supplemental Data Sheet 7).
The liver displayed a shift from cell adhesion and focal adhesion at day 7 to lipid and fatty acid metabolic programs at days 21 and 35, including cellular ketone metabolism and fatty acid β oxidation. These terms reflect the delayed but broad metabolic reprogramming seen in the liver during HS diet–induced hypertension. The heart showed little enrichment early on, with developmental terms on day 14. By day 35, prominent enrichment for contractile and ion transport programs emerged, including heart contraction, muscle system process, and metal ion transport, highlighting structural and functional remodeling in late-stage disease.
We next extended our analysis to all DEGs per organ and time point to capture broader patterns of biological pathways in HS diet–induced hypertensive injury. We performed GO-BP (Supplemental Figure 8 and Supplemental Data Sheet 8) and Hallmark pathway enrichment analyses (Supplemental Figure 9 and Supplemental Data Sheet 9) on the complete sets of DEGs, stratified by organ and time point. Together, these analyses reveal how HS diet–induced hypertensive injury drives both temporal and organ-specific transcriptional responses, as well as broader biological processes that are active across multiple stages and shared among organs. We show that individual organs deploy distinct molecular programs while also participating in common stress-related pathways. This integrated view helps explain how different tissues respond in parallel yet uniquely to HS diet–induced hypertensive injury.
Dynamic TF-target gene networks coordinate specific responses in salt-induced hypertensive injury. To infer upstream regulators of transcriptomic changes, we used the ChEA 2022 database, a high-confidence resource of TF-target interactions from ChIP-seq and ChIP-chip studies (25, 26). Performing enrichment analysis of DEGs against the ChEA database identified candidate TFs likely driving the tissue- and time-specific transcriptional programs in HS diet–induced hypertensive injury (Supplemental Figure 10 and Supplemental Data Sheet 10). All TFs emerging from this analysis with Padj < 0.05 across all tissue and time point combinations were aggregated. From this comprehensive set, we further selected TFs that were, themselves, significantly differentially expressed, thereby prioritizing TFs both statistically enriched for targeting DEGs and directly responsive to HS diet–induced hypertensive injury. This 2-step filtering yielded a final set of 79 high-confidence TFs (Supplemental Figure 11A). To investigate how TF regulation evolves across tissues and over time, we applied PCA and UMAP to expression profiles of 79 high-confidence TFs, with PCA separating tissues by major transcriptional variance and UMAP resolving tissue-specific and temporal shifts in HS diet–induced hypertensive injury (Supplemental Figure 11B).
To identify which TFs differentiate tissue-specific responses over time, we applied random forest classifiers at each time point using the expression profiles of 79 TFs as input features and tissue identity as the classification target. Feature importance was assessed using the mean decrease in Gini impurity, a measure of how much each TF contributes to accurately distinguishing tissue-specific profiles. Through this supervised classification approach, we identified TFs most responsible for separating tissue-specific responses at different phases of HS diet–induced hypertensive injury (Supplemental Figure 11C). Next, to map the temporal involvement of TFs, we identified TFs that were significantly differentially expressed in 1 tissue at a given time point. These were classified as organ-time unique TFs capturing tissue and time-restricted activity (Figure 5A and Supplemental Data Sheet 11). This analysis revealed tissue- and time-dependent heterogeneity in TF expression.
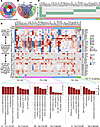 Figure 5
High-salt diet–induced hypertension drives organ-specific regulatory programs. (A) Concentric donut plot displaying the number of significantly differentially expressed transcription factors (TFs) per tissue (inner ring) and their distribution across 4 time points (days 7, 14, 21, and 35). (B) Venn diagram depicting the overlap and exclusivity of TFs across cortex, medulla, liver, and heart, identifying shared versus tissue-specific TFs. (C) Unique TFs per tissue and shared TFs visualized as a binary heatmap. (D) TF-target genes network and functional relevance analysis. Top heatmap: showing the expression dynamics of 2 core and unique TFs across 16 tissue–time point combinations. Asterisks denote significantly altered TFs (|log2 fold change| ≥ 0.585, equivalent to a fold change ≥ 1.5 and Padj < 0.05). Middle heatmap: showing mean log2FC of TF-regulated target genes. Lower pathway panel: showing top 5 GO Biological Processes (left) and Hallmark pathways (right) for CX, MD, and LV emerged by TF-regulated target genes. Bar heights represent –log10 Padj values. Target gene (TG) counts indicate the number of organ-specific genes regulated by corresponding TFs and used in the pathway analysis. No pathways met significance thresholds in HR. Enriched pathways with Padj < 0.05 were considered significant. CX, cortex; MD, medulla; LV, liver; HR, heart; D7, day 7; D14, day 14; D21, day 21; and D35, day 35 time points. Padj indicates Padj value. n = 6 male rats per group.
To assess the degree of overlap in transcriptional regulation across tissues, we constructed a 4-way Venn diagram of all TFs (Figure 5B). This analysis revealed 44 TF genes exhibiting organ-specific regulation. Only 2 TF genes, BCL6 transcription repressor (Bcl6) and RUNX family TF 1 (Runx1), were shared across all 4 tissues, indicating that TF activity in HS diet–induced hypertensive injury is largely tissue specific. To explore this organ specificity in greater detail and extend the overlap patterns seen in the Venn diagrams, we generated a binary presence-absence heatmap of organ-unique TFs (Figure 5C), providing a more granular view by displaying each TF individually and revealing clear segregation of TFs by tissues. Next, to assess whether organ-unique TFs impose functional control on downstream genes, we mapped ChEA predicted targets for each of the 44 TFs that remained restricted to a single tissue across the experiment. For every tissue, we compiled only the targets linked to its own unique TFs and overlaid TFs and target gene expression onto our RNA-seq data. (The expression dynamics of multiple organ-unique TFs paralleled those of their predicted targets, indicating the functional coherence of these regulatory relationships (Figure 5D). This coordinated activity suggests that TFs do not operate in isolation but, instead, regulate structured transcriptional modules that drive specific responses in HS diet–induced hypertensive injury. The magnitude of these regulons varied substantially across tissues, with medulla-unique TFs regulating the largest gene networks, followed by those in the liver, cortex, and heart. Pathway analysis of the organ-specific target pools revealed distinct biological themes. Cortex regulons were enriched for immune cell differentiation and activation, EMT, TNFA signaling via NF-κB, hypoxia, and IL-2–STAT5 signaling. Alongside, medulla regulons were dominated by catabolic and metabolic processes, Kras signaling, IL-6/JAK/STAT3 signaling, and xenobiotic metabolism. Whereas liver-restricted TFs were associated with pathways involving cell-substrate adhesion, steroid hormone response, ketone metabolism, lymphocyte differentiation, TNFA signaling via NF-κB, hypoxia, apoptosis, and EMT (Figure 5D and Supplemental Data Sheet 12).
In summary, identified 79 high-confidence TFs and mapped their dynamic, tissue-specific regulatory networks in HS diet–induced hypertensive injury, yielding a curated list of candidate targets for mechanistic and translational studies.
Integration with the human GWAS reveals a conserved hypertension- and CKD-linked transcriptional response. To determine whether the transcriptional programs altered in our hypertensive rat model are relevant to human disease, we integrated our transcriptomic data with human GWAS loci for the terms “hypertension” and “chronic kidney disease.” Among the 5,213 rat DEGs mapped to human orthologs, 100 genes overlapped with hypertension-associated GWAS genes, comprising a total of 386 genes (Supplemental Figure 12A), and 143 genes intersected with CKD-associated genes spanning 406 total genes (Supplemental Figure 12B). These overlaps represented highly significant enrichments (Fisher’s exact test, P < 0.0001; odds ratios = 2.4 for hypertension and 3.8 for CKD), highlighting that the transcriptional shifts seen in our rat model overlap strongly with known human hypertension and CKD risk loci-associated genes. Expression analysis of these overlapping genes revealed distinct temporal and tissue-specific expression patterns (Supplemental Figure 13). Further analysis across GO-BP, KEGG, and Reactome databases shows that hypertension-linked genes are dominated by developmental and endocrine pathways (Supplemental Figure 12C and Supplemental Figure 14, A–C). In contrast, CKD-linked genes were enriched for metabolic and detoxification pathways (Supplemental Figure 12D and Supplemental Figure 14, A, D, and E).
To translate the GWAS-overlap lists into mechanistic circuitry, we constructed PPI networks using STRING (confidence > 0.4 for hypertension and > 0.7 for CKD) and applied Louvain clustering (27) to identify discrete communities. With this approach, 100 GWAS overlap gene-associated proteins of hypertension were segregated into 7 modules (Supplemental Figure 12E). A connected ion-flux core (M1, cardiac muscle cell action potential involved in contraction) was anchored by calcium-handling hubs calcium voltage-gated channel subunit α 1 D (CACNA1D) and potassium inwardly rectifying channel subfamily J member 2 (KCNJ2), together with the gap junction protein α 1 (GJA1), defining an electrically responsive scaffold. A collagen-activated tyrosine kinase receptor module (M4), built around collagen type IV α 1 chain (COL4A1) and collagen type VI α 3 chain (COL6A3), linked extracellular matrix remodeling to this ion-flux hub, consistent with pressure-induced structural adaptation. The hormone-metabolic module (M3) expanded this circuitry by incorporating one-carbon and lipid transport elements, such as methylenetetrahydrofolate reductase (MTHFR), which aligns folate-dependent methyl flux with the cholesterol carrier apolipoprotein E (APOE) and a suite of steroid-modifying enzymes. MTHFR also maintained a high-confidence connection to cytochrome P450 family 17 subfamily A member 1 (CYP17A1), the anchor of the steroid-biosynthetic module (M6). This bridge places methyl-group supply in close proximity to cortisol and androgen synthesis, suggesting that folate status could influence endocrine output during the hypertensive response. In contrast, the cAMP-signaling triad (M7), containing phosphodiesterase 3A (PDE3A), phosphodiesterase 1A (PDE1A), and ectonucleotide pyrophosphatase/phosphodiesterase 3 (ENPP3), was topologically isolated, indicating that cyclic-nucleotide regulation operates as an independent signaling node.
Analysis of the CKD GWAS-overlap interactome (Supplemental Figure 12F) resolved 8 discrete communities. The M1 module, annotated as organic-acid catabolic process, represents a β-oxidation axis anchored by acyl-CoA dehydrogenase long chain (ACADL), acyl-CoA dehydrogenase medium chain (ACADM), acyl-CoA dehydrogenase short chain (ACADS), and the peroxisomal oxidase acyl-CoA oxidase 1 (ACOX1). Attached to M1, the M2 module (olefinic-compound metabolic process) includes the long-chain desaturases fatty acid desaturase 1 (FADS1), fatty acid desaturase 2 (FADS2), and the elongase ELOVL fatty acid elongase 2 (ELOVL2), showing that unsaturated fatty acid synthesis feeds into downstream β-oxidation. A multifunctional detoxification cluster emerged alongside these lipid modules, enriched for cytochrome P450 enzymes, the eicosanoid synthase arachidonate 15-lipoxygenase (ALOX15), and glutathione-handling proteins glutathione S-transferase mu 2 (GSTM2), and γ-glutamyltransferase 1 (GGT1). Edges connecting adjacent transporter-enriched communities — comprising SLC family members solute carrier family 22 member 1 (SLC22A1), solute carrier family 22 member 2 (SLC22A2), solute carrier family 2 member 9 (SLC2A9), solute carrier family 28 member 2 (SLC28A2), and the ABC transporter ATP binding cassette subfamily G member 2 (ABCG2) — suggest potential coordination in handling lipid-derived metabolites and purine catabolites through parallel excretory pathways. In parallel, several metabolic programs remained topologically insulated. A compact kynurenine module composed of kynureninase (KYNU), kynurenine 3-monooxygenase (KMO), kynurenine aminotransferase 3 (KYAT3), and arylformamidase (AFMID) forms a dedicated tryptophan-metabolism circuit. Likewise, the nucleotide metabolism group, including flap structure-specific endonuclease 1 (FEN1), thymidylate synthase (TYMS), and myelin regulatory factor (MYRF), and the developmental cluster, comprising roundabout guidance receptor 1 (ROBO1), slit guidance ligand 2 (SLIT2), and adhesion G protein-coupled receptor L3 (ADGRL3), occupy peripheral positions.
In summary, our data detect genes linked to human GWAS loci for hypertension and CKD. These conserved signatures underscore the translational relevance of our findings for dissecting multiorgan disease mechanisms in HS diet–induced hypertensive injury.
Compound-transcriptome mapping reveals stage- and organ-specific therapeutic opportunities. To systematically identify compounds that could reverse HS diet–induced hypertensive injury-associated transcriptional programs, we leveraged the Library of Integrated Network-Based Cellular Signatures (LINCS) database (28, 29). Our LINCS-based predictive compound–transcriptome analysis identified several high-confidence compounds with the potential to reverse maladaptive gene profiles across organs (Figure 6 and Supplemental Figure 15). In the kidney cortex, NVP-BEZ235 (dual phosphoinositide 3-kinase/mechanistic target of rapamycin [PI3K/mTOR] inhibitor), dovitinib (fibroblast growth factor receptor/vascular endothelial growth factor receptor [FGFR/VEGFR] inhibitor), and palbociclib (cyclin-dependent kinase 4/6 [CDK4/6] inhibitor) were predicted to most effectively counter sustained induction of E2F target genes, G2M checkpoint components, and mechanistic target of rapamycin complex 1 (mTORC1) signaling pathways driving proliferative expansion and metabolic alterations (Figure 6A). These findings suggest that coordinated inhibition of growth factor receptors and cell-cycle regulators may restore transcriptional homeostasis in cortical tissue.
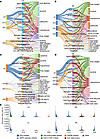 Figure 6
Temporal and organ-specific prediction of small-molecule modulators to target salt-induced hypertensive gene signatures. (A–D) Sankey diagrams integrating differential expression profiles with LINCS L1000 chemical perturbation signatures for significantly upregulated genes in the kidney cortex (A), kidney medulla (B), liver (C), and heart (D). Each network connects time points (days 7–35; left), enriched top 5 Hallmark pathways (middle), and the top predicted small molecules (right) prioritized for their potential to reverse disease-associated transcriptional changes. Edge thickness denotes −log10(Padj value), indicating enrichment strength. (E) Stacked stream graphs show, for each tissue, the cumulative enrichment of small-molecule classes at each time point, represented as the summed –log10(Padj value) of all compounds within each class. Peaks indicate phases when a given class is most strongly aligned with the organ-specific transcriptome. CX, cortex; MD, medulla; LV, liver; HR, heart; D7, day 7; D14, day 14; D21, day 21; and D35, day 35 time points. Padj indicates Padj value. n = 6 male rats per group.
In the kidney medulla, PHA-793887 (multi-CDK inhibitor), dovitinib, mitoxantrone, palbociclib, and sorafenib (multi-kinase inhibitor) emerged as prominent candidates predicted to reverse maladaptive proliferative programs and concurrent activation of IFN-γ and Janus kinase/signal transducer and activator of transcription 3 (JAK/STAT3) inflammatory pathways (Figure 6B). Notably, selective mitogen-activated protein kinase (MEK) inhibitors, including PD-0325901 and PD-184352, were also associated with reversal of downregulated metabolic pathways such as fatty acid metabolism and oxidative phosphorylation (Supplemental Figure 15B), suggesting their potential to reactivate suppressed metabolism. This combinatorial signature highlights a dual proliferative-inflammatory axis as a therapeutic target in medullary injury.
In the liver, compounds such as canertinib (epidermal growth factor receptor/human epidermal growth factor receptor 2 [EGFR/HER2] inhibitor), dovitinib, mitoxantrone, PHA-793887, palbociclib, and CGP-60474 (broad-spectrum CDK inhibitor) were consistently prioritized to counter maladaptive proliferation, unfolded protein response, and NF-κB–mediated inflammatory signaling (Figure 6C). Additionally, MEK inhibitors (PD-0325901, AZD-8330, and selumetinib), along with decitabine (a DNA methyltransferase inhibitor), and withaferin A (a natural steroidal lactone), were predicted to restore downregulated transcriptional programs (Supplemental Figure 15C). These findings underscore the dual potential of kinase and epigenetic modulators to suppress pathogenic activation while reactivating metabolic pathways central to hepatic remodeling.
In the heart, enrichment was observed for PHA-793887, dovitinib, mitoxantrone, NVP-BEZ235, radicicol (heat shock protein 90 [HSP90] inhibitor), and GDC-0941 (PI3K inhibitor) to counter early mitotic gene induction and subsequent angiogenic and inflammatory activation (Figure 6D). MEK inhibitors (AZD-8330, trametinib), EGFR/ERBB family inhibitors (neratinib, erlotinib, afatinib), and radicicol were recurrently associated with restoration of downregulated programs spanning xenobiotic metabolism, adipogenesis, and estrogen response (Supplemental Figure 15D), highlighting the capacity of pathway-selective inhibitors to normalize both hyperactivated and suppressed networks.
To further resolve how pharmacologic predictions change over the course of disease, we classified compounds into mechanistic classes and quantified their enrichment dynamics across disease progression (Figure 6E). Temporal analysis revealed early enrichment of cell-cycle and receptor tyrosine kinase (RTK) inhibitors, shifting toward PI3K/mTOR and HSP90 inhibitors at later stages. These patterns demonstrate that different classes of compounds are preferentially predicted at distinct disease phases, further reflecting evolving pathophysiological mechanisms as salt-induced hypertensive injury progresses. Collectively, this integrated analysis predicts pharmacologic candidates and their effect on different biological pathways. These findings suggest the need for precision medicine approaches. Such approaches should not focus solely on lowering blood pressure but also account for the duration of hypertension, organ damage, and associated molecular pathways.


