
Research ArticleImmunologyPulmonologyVirology
Open Access |  10.1172/jci.insight.203283
SARS-CoV-2 infection produces an IL-33–dependent chronic eosinophilic pneumonia and muco-inflammatory airways disease in Scnn1b-Tg mice
Padraig E. Hawkins,1 Sarah R. Leist,2 Hong Dang,1 Minako Saito,1 Lisa C. Morton,1 Jesse B. Hines,3 Rodney C. Gilmore,1 Stephen A. Schworer,1 Ella F. Burns,1 Jason R. Rock,4 Robert S. Hagan,1 James J. Pestka,5 Alexandra Schäfer,2 Kenichi Okuda,1 Lauren K. Heine,6,7 Jack R. Harkema,8 Wanda K. O’Neal,1 Alessandra Livraghi-Butrico,1 Raymond J. Pickles,1,9 Ralph S. Baric,2 and Richard C. Boucher1
1Marsico Lung Institute/Cystic Fibrosis Research Center, School of Medicine, University of North Carolina at Chapel Hill, Chapel Hill, North Carolina, USA.
2Department of Epidemiology, Gillings School of Global Public Health, University of North Carolina at Chapel Hill, Chapel Hill, North Carolina, USA.
3Competitive Labs, Hoover, Alabama.
4Department of Immunology Discovery, Genentech Inc., San Francisco, California, USA.
5Department of Food Science and Human Nutrition and
6Department of Pharmacology and Toxicology, Michigan State University, East Lansing, Michigan, USA.
7Department of Pharmaceutical Sciences, The University of New Mexico College of Pharmacy, Albuquerque, New Mexico, USA.
8Department of Pathobiology and Diagnostic Investigation, Michigan State University, East Lansing, Michigan, USA.
9Department of Microbiology and Immunology, University of North Carolina at Chapel Hill, Chapel Hill, North Carolina, USA.
Address correspondence to: Padraig E. Hawkins, 7008 Marsico Hall, Chapel Hill, North Carolina 27599-7248, USA. Phone: 919.966.7064; Email: padraig_hawkins@med.unc.edu. Or to: Richard C. Boucher, 7008 Marsico Hall, 125 Mason Farm Road, Chapel Hill, North Carolina 27599-7248, USA. Phone: 919.966.7064; Email: richard_boucher@med.unc.edu.
Authorship note: PEH and SRL contributed equally to this work.
Find articles by Hawkins, P. in: PubMed | Google Scholar
1Marsico Lung Institute/Cystic Fibrosis Research Center, School of Medicine, University of North Carolina at Chapel Hill, Chapel Hill, North Carolina, USA.
2Department of Epidemiology, Gillings School of Global Public Health, University of North Carolina at Chapel Hill, Chapel Hill, North Carolina, USA.
3Competitive Labs, Hoover, Alabama.
4Department of Immunology Discovery, Genentech Inc., San Francisco, California, USA.
5Department of Food Science and Human Nutrition and
6Department of Pharmacology and Toxicology, Michigan State University, East Lansing, Michigan, USA.
7Department of Pharmaceutical Sciences, The University of New Mexico College of Pharmacy, Albuquerque, New Mexico, USA.
8Department of Pathobiology and Diagnostic Investigation, Michigan State University, East Lansing, Michigan, USA.
9Department of Microbiology and Immunology, University of North Carolina at Chapel Hill, Chapel Hill, North Carolina, USA.
Address correspondence to: Padraig E. Hawkins, 7008 Marsico Hall, Chapel Hill, North Carolina 27599-7248, USA. Phone: 919.966.7064; Email: padraig_hawkins@med.unc.edu. Or to: Richard C. Boucher, 7008 Marsico Hall, 125 Mason Farm Road, Chapel Hill, North Carolina 27599-7248, USA. Phone: 919.966.7064; Email: richard_boucher@med.unc.edu.
Authorship note: PEH and SRL contributed equally to this work.
Find articles by
Leist, S.
in:
PubMed
|
Google Scholar
|

1Marsico Lung Institute/Cystic Fibrosis Research Center, School of Medicine, University of North Carolina at Chapel Hill, Chapel Hill, North Carolina, USA.
2Department of Epidemiology, Gillings School of Global Public Health, University of North Carolina at Chapel Hill, Chapel Hill, North Carolina, USA.
3Competitive Labs, Hoover, Alabama.
4Department of Immunology Discovery, Genentech Inc., San Francisco, California, USA.
5Department of Food Science and Human Nutrition and
6Department of Pharmacology and Toxicology, Michigan State University, East Lansing, Michigan, USA.
7Department of Pharmaceutical Sciences, The University of New Mexico College of Pharmacy, Albuquerque, New Mexico, USA.
8Department of Pathobiology and Diagnostic Investigation, Michigan State University, East Lansing, Michigan, USA.
9Department of Microbiology and Immunology, University of North Carolina at Chapel Hill, Chapel Hill, North Carolina, USA.
Address correspondence to: Padraig E. Hawkins, 7008 Marsico Hall, Chapel Hill, North Carolina 27599-7248, USA. Phone: 919.966.7064; Email: padraig_hawkins@med.unc.edu. Or to: Richard C. Boucher, 7008 Marsico Hall, 125 Mason Farm Road, Chapel Hill, North Carolina 27599-7248, USA. Phone: 919.966.7064; Email: richard_boucher@med.unc.edu.
Authorship note: PEH and SRL contributed equally to this work.
Find articles by
Dang, H.
in:
PubMed
|
Google Scholar
|
1Marsico Lung Institute/Cystic Fibrosis Research Center, School of Medicine, University of North Carolina at Chapel Hill, Chapel Hill, North Carolina, USA.
2Department of Epidemiology, Gillings School of Global Public Health, University of North Carolina at Chapel Hill, Chapel Hill, North Carolina, USA.
3Competitive Labs, Hoover, Alabama.
4Department of Immunology Discovery, Genentech Inc., San Francisco, California, USA.
5Department of Food Science and Human Nutrition and
6Department of Pharmacology and Toxicology, Michigan State University, East Lansing, Michigan, USA.
7Department of Pharmaceutical Sciences, The University of New Mexico College of Pharmacy, Albuquerque, New Mexico, USA.
8Department of Pathobiology and Diagnostic Investigation, Michigan State University, East Lansing, Michigan, USA.
9Department of Microbiology and Immunology, University of North Carolina at Chapel Hill, Chapel Hill, North Carolina, USA.
Address correspondence to: Padraig E. Hawkins, 7008 Marsico Hall, Chapel Hill, North Carolina 27599-7248, USA. Phone: 919.966.7064; Email: padraig_hawkins@med.unc.edu. Or to: Richard C. Boucher, 7008 Marsico Hall, 125 Mason Farm Road, Chapel Hill, North Carolina 27599-7248, USA. Phone: 919.966.7064; Email: richard_boucher@med.unc.edu.
Authorship note: PEH and SRL contributed equally to this work.
Find articles by Saito, M. in: PubMed | Google Scholar
1Marsico Lung Institute/Cystic Fibrosis Research Center, School of Medicine, University of North Carolina at Chapel Hill, Chapel Hill, North Carolina, USA.
2Department of Epidemiology, Gillings School of Global Public Health, University of North Carolina at Chapel Hill, Chapel Hill, North Carolina, USA.
3Competitive Labs, Hoover, Alabama.
4Department of Immunology Discovery, Genentech Inc., San Francisco, California, USA.
5Department of Food Science and Human Nutrition and
6Department of Pharmacology and Toxicology, Michigan State University, East Lansing, Michigan, USA.
7Department of Pharmaceutical Sciences, The University of New Mexico College of Pharmacy, Albuquerque, New Mexico, USA.
8Department of Pathobiology and Diagnostic Investigation, Michigan State University, East Lansing, Michigan, USA.
9Department of Microbiology and Immunology, University of North Carolina at Chapel Hill, Chapel Hill, North Carolina, USA.
Address correspondence to: Padraig E. Hawkins, 7008 Marsico Hall, Chapel Hill, North Carolina 27599-7248, USA. Phone: 919.966.7064; Email: padraig_hawkins@med.unc.edu. Or to: Richard C. Boucher, 7008 Marsico Hall, 125 Mason Farm Road, Chapel Hill, North Carolina 27599-7248, USA. Phone: 919.966.7064; Email: richard_boucher@med.unc.edu.
Authorship note: PEH and SRL contributed equally to this work.
Find articles by Morton, L. in: PubMed | Google Scholar
1Marsico Lung Institute/Cystic Fibrosis Research Center, School of Medicine, University of North Carolina at Chapel Hill, Chapel Hill, North Carolina, USA.
2Department of Epidemiology, Gillings School of Global Public Health, University of North Carolina at Chapel Hill, Chapel Hill, North Carolina, USA.
3Competitive Labs, Hoover, Alabama.
4Department of Immunology Discovery, Genentech Inc., San Francisco, California, USA.
5Department of Food Science and Human Nutrition and
6Department of Pharmacology and Toxicology, Michigan State University, East Lansing, Michigan, USA.
7Department of Pharmaceutical Sciences, The University of New Mexico College of Pharmacy, Albuquerque, New Mexico, USA.
8Department of Pathobiology and Diagnostic Investigation, Michigan State University, East Lansing, Michigan, USA.
9Department of Microbiology and Immunology, University of North Carolina at Chapel Hill, Chapel Hill, North Carolina, USA.
Address correspondence to: Padraig E. Hawkins, 7008 Marsico Hall, Chapel Hill, North Carolina 27599-7248, USA. Phone: 919.966.7064; Email: padraig_hawkins@med.unc.edu. Or to: Richard C. Boucher, 7008 Marsico Hall, 125 Mason Farm Road, Chapel Hill, North Carolina 27599-7248, USA. Phone: 919.966.7064; Email: richard_boucher@med.unc.edu.
Authorship note: PEH and SRL contributed equally to this work.
Find articles by Hines, J. in: PubMed | Google Scholar
1Marsico Lung Institute/Cystic Fibrosis Research Center, School of Medicine, University of North Carolina at Chapel Hill, Chapel Hill, North Carolina, USA.
2Department of Epidemiology, Gillings School of Global Public Health, University of North Carolina at Chapel Hill, Chapel Hill, North Carolina, USA.
3Competitive Labs, Hoover, Alabama.
4Department of Immunology Discovery, Genentech Inc., San Francisco, California, USA.
5Department of Food Science and Human Nutrition and
6Department of Pharmacology and Toxicology, Michigan State University, East Lansing, Michigan, USA.
7Department of Pharmaceutical Sciences, The University of New Mexico College of Pharmacy, Albuquerque, New Mexico, USA.
8Department of Pathobiology and Diagnostic Investigation, Michigan State University, East Lansing, Michigan, USA.
9Department of Microbiology and Immunology, University of North Carolina at Chapel Hill, Chapel Hill, North Carolina, USA.
Address correspondence to: Padraig E. Hawkins, 7008 Marsico Hall, Chapel Hill, North Carolina 27599-7248, USA. Phone: 919.966.7064; Email: padraig_hawkins@med.unc.edu. Or to: Richard C. Boucher, 7008 Marsico Hall, 125 Mason Farm Road, Chapel Hill, North Carolina 27599-7248, USA. Phone: 919.966.7064; Email: richard_boucher@med.unc.edu.
Authorship note: PEH and SRL contributed equally to this work.
Find articles by Gilmore, R. in: PubMed | Google Scholar
1Marsico Lung Institute/Cystic Fibrosis Research Center, School of Medicine, University of North Carolina at Chapel Hill, Chapel Hill, North Carolina, USA.
2Department of Epidemiology, Gillings School of Global Public Health, University of North Carolina at Chapel Hill, Chapel Hill, North Carolina, USA.
3Competitive Labs, Hoover, Alabama.
4Department of Immunology Discovery, Genentech Inc., San Francisco, California, USA.
5Department of Food Science and Human Nutrition and
6Department of Pharmacology and Toxicology, Michigan State University, East Lansing, Michigan, USA.
7Department of Pharmaceutical Sciences, The University of New Mexico College of Pharmacy, Albuquerque, New Mexico, USA.
8Department of Pathobiology and Diagnostic Investigation, Michigan State University, East Lansing, Michigan, USA.
9Department of Microbiology and Immunology, University of North Carolina at Chapel Hill, Chapel Hill, North Carolina, USA.
Address correspondence to: Padraig E. Hawkins, 7008 Marsico Hall, Chapel Hill, North Carolina 27599-7248, USA. Phone: 919.966.7064; Email: padraig_hawkins@med.unc.edu. Or to: Richard C. Boucher, 7008 Marsico Hall, 125 Mason Farm Road, Chapel Hill, North Carolina 27599-7248, USA. Phone: 919.966.7064; Email: richard_boucher@med.unc.edu.
Authorship note: PEH and SRL contributed equally to this work.
Find articles by
Schworer, S.
in:
PubMed
|
Google Scholar
|
1Marsico Lung Institute/Cystic Fibrosis Research Center, School of Medicine, University of North Carolina at Chapel Hill, Chapel Hill, North Carolina, USA.
2Department of Epidemiology, Gillings School of Global Public Health, University of North Carolina at Chapel Hill, Chapel Hill, North Carolina, USA.
3Competitive Labs, Hoover, Alabama.
4Department of Immunology Discovery, Genentech Inc., San Francisco, California, USA.
5Department of Food Science and Human Nutrition and
6Department of Pharmacology and Toxicology, Michigan State University, East Lansing, Michigan, USA.
7Department of Pharmaceutical Sciences, The University of New Mexico College of Pharmacy, Albuquerque, New Mexico, USA.
8Department of Pathobiology and Diagnostic Investigation, Michigan State University, East Lansing, Michigan, USA.
9Department of Microbiology and Immunology, University of North Carolina at Chapel Hill, Chapel Hill, North Carolina, USA.
Address correspondence to: Padraig E. Hawkins, 7008 Marsico Hall, Chapel Hill, North Carolina 27599-7248, USA. Phone: 919.966.7064; Email: padraig_hawkins@med.unc.edu. Or to: Richard C. Boucher, 7008 Marsico Hall, 125 Mason Farm Road, Chapel Hill, North Carolina 27599-7248, USA. Phone: 919.966.7064; Email: richard_boucher@med.unc.edu.
Authorship note: PEH and SRL contributed equally to this work.
Find articles by Burns, E. in: PubMed | Google Scholar
1Marsico Lung Institute/Cystic Fibrosis Research Center, School of Medicine, University of North Carolina at Chapel Hill, Chapel Hill, North Carolina, USA.
2Department of Epidemiology, Gillings School of Global Public Health, University of North Carolina at Chapel Hill, Chapel Hill, North Carolina, USA.
3Competitive Labs, Hoover, Alabama.
4Department of Immunology Discovery, Genentech Inc., San Francisco, California, USA.
5Department of Food Science and Human Nutrition and
6Department of Pharmacology and Toxicology, Michigan State University, East Lansing, Michigan, USA.
7Department of Pharmaceutical Sciences, The University of New Mexico College of Pharmacy, Albuquerque, New Mexico, USA.
8Department of Pathobiology and Diagnostic Investigation, Michigan State University, East Lansing, Michigan, USA.
9Department of Microbiology and Immunology, University of North Carolina at Chapel Hill, Chapel Hill, North Carolina, USA.
Address correspondence to: Padraig E. Hawkins, 7008 Marsico Hall, Chapel Hill, North Carolina 27599-7248, USA. Phone: 919.966.7064; Email: padraig_hawkins@med.unc.edu. Or to: Richard C. Boucher, 7008 Marsico Hall, 125 Mason Farm Road, Chapel Hill, North Carolina 27599-7248, USA. Phone: 919.966.7064; Email: richard_boucher@med.unc.edu.
Authorship note: PEH and SRL contributed equally to this work.
Find articles by Rock, J. in: PubMed | Google Scholar
1Marsico Lung Institute/Cystic Fibrosis Research Center, School of Medicine, University of North Carolina at Chapel Hill, Chapel Hill, North Carolina, USA.
2Department of Epidemiology, Gillings School of Global Public Health, University of North Carolina at Chapel Hill, Chapel Hill, North Carolina, USA.
3Competitive Labs, Hoover, Alabama.
4Department of Immunology Discovery, Genentech Inc., San Francisco, California, USA.
5Department of Food Science and Human Nutrition and
6Department of Pharmacology and Toxicology, Michigan State University, East Lansing, Michigan, USA.
7Department of Pharmaceutical Sciences, The University of New Mexico College of Pharmacy, Albuquerque, New Mexico, USA.
8Department of Pathobiology and Diagnostic Investigation, Michigan State University, East Lansing, Michigan, USA.
9Department of Microbiology and Immunology, University of North Carolina at Chapel Hill, Chapel Hill, North Carolina, USA.
Address correspondence to: Padraig E. Hawkins, 7008 Marsico Hall, Chapel Hill, North Carolina 27599-7248, USA. Phone: 919.966.7064; Email: padraig_hawkins@med.unc.edu. Or to: Richard C. Boucher, 7008 Marsico Hall, 125 Mason Farm Road, Chapel Hill, North Carolina 27599-7248, USA. Phone: 919.966.7064; Email: richard_boucher@med.unc.edu.
Authorship note: PEH and SRL contributed equally to this work.
Find articles by
Hagan, R.
in:
PubMed
|
Google Scholar
|
1Marsico Lung Institute/Cystic Fibrosis Research Center, School of Medicine, University of North Carolina at Chapel Hill, Chapel Hill, North Carolina, USA.
2Department of Epidemiology, Gillings School of Global Public Health, University of North Carolina at Chapel Hill, Chapel Hill, North Carolina, USA.
3Competitive Labs, Hoover, Alabama.
4Department of Immunology Discovery, Genentech Inc., San Francisco, California, USA.
5Department of Food Science and Human Nutrition and
6Department of Pharmacology and Toxicology, Michigan State University, East Lansing, Michigan, USA.
7Department of Pharmaceutical Sciences, The University of New Mexico College of Pharmacy, Albuquerque, New Mexico, USA.
8Department of Pathobiology and Diagnostic Investigation, Michigan State University, East Lansing, Michigan, USA.
9Department of Microbiology and Immunology, University of North Carolina at Chapel Hill, Chapel Hill, North Carolina, USA.
Address correspondence to: Padraig E. Hawkins, 7008 Marsico Hall, Chapel Hill, North Carolina 27599-7248, USA. Phone: 919.966.7064; Email: padraig_hawkins@med.unc.edu. Or to: Richard C. Boucher, 7008 Marsico Hall, 125 Mason Farm Road, Chapel Hill, North Carolina 27599-7248, USA. Phone: 919.966.7064; Email: richard_boucher@med.unc.edu.
Authorship note: PEH and SRL contributed equally to this work.
Find articles by Pestka, J. in: PubMed | Google Scholar
1Marsico Lung Institute/Cystic Fibrosis Research Center, School of Medicine, University of North Carolina at Chapel Hill, Chapel Hill, North Carolina, USA.
2Department of Epidemiology, Gillings School of Global Public Health, University of North Carolina at Chapel Hill, Chapel Hill, North Carolina, USA.
3Competitive Labs, Hoover, Alabama.
4Department of Immunology Discovery, Genentech Inc., San Francisco, California, USA.
5Department of Food Science and Human Nutrition and
6Department of Pharmacology and Toxicology, Michigan State University, East Lansing, Michigan, USA.
7Department of Pharmaceutical Sciences, The University of New Mexico College of Pharmacy, Albuquerque, New Mexico, USA.
8Department of Pathobiology and Diagnostic Investigation, Michigan State University, East Lansing, Michigan, USA.
9Department of Microbiology and Immunology, University of North Carolina at Chapel Hill, Chapel Hill, North Carolina, USA.
Address correspondence to: Padraig E. Hawkins, 7008 Marsico Hall, Chapel Hill, North Carolina 27599-7248, USA. Phone: 919.966.7064; Email: padraig_hawkins@med.unc.edu. Or to: Richard C. Boucher, 7008 Marsico Hall, 125 Mason Farm Road, Chapel Hill, North Carolina 27599-7248, USA. Phone: 919.966.7064; Email: richard_boucher@med.unc.edu.
Authorship note: PEH and SRL contributed equally to this work.
Find articles by Schäfer, A. in: PubMed | Google Scholar
1Marsico Lung Institute/Cystic Fibrosis Research Center, School of Medicine, University of North Carolina at Chapel Hill, Chapel Hill, North Carolina, USA.
2Department of Epidemiology, Gillings School of Global Public Health, University of North Carolina at Chapel Hill, Chapel Hill, North Carolina, USA.
3Competitive Labs, Hoover, Alabama.
4Department of Immunology Discovery, Genentech Inc., San Francisco, California, USA.
5Department of Food Science and Human Nutrition and
6Department of Pharmacology and Toxicology, Michigan State University, East Lansing, Michigan, USA.
7Department of Pharmaceutical Sciences, The University of New Mexico College of Pharmacy, Albuquerque, New Mexico, USA.
8Department of Pathobiology and Diagnostic Investigation, Michigan State University, East Lansing, Michigan, USA.
9Department of Microbiology and Immunology, University of North Carolina at Chapel Hill, Chapel Hill, North Carolina, USA.
Address correspondence to: Padraig E. Hawkins, 7008 Marsico Hall, Chapel Hill, North Carolina 27599-7248, USA. Phone: 919.966.7064; Email: padraig_hawkins@med.unc.edu. Or to: Richard C. Boucher, 7008 Marsico Hall, 125 Mason Farm Road, Chapel Hill, North Carolina 27599-7248, USA. Phone: 919.966.7064; Email: richard_boucher@med.unc.edu.
Authorship note: PEH and SRL contributed equally to this work.
Find articles by
Okuda, K.
in:
PubMed
|
Google Scholar
|
1Marsico Lung Institute/Cystic Fibrosis Research Center, School of Medicine, University of North Carolina at Chapel Hill, Chapel Hill, North Carolina, USA.
2Department of Epidemiology, Gillings School of Global Public Health, University of North Carolina at Chapel Hill, Chapel Hill, North Carolina, USA.
3Competitive Labs, Hoover, Alabama.
4Department of Immunology Discovery, Genentech Inc., San Francisco, California, USA.
5Department of Food Science and Human Nutrition and
6Department of Pharmacology and Toxicology, Michigan State University, East Lansing, Michigan, USA.
7Department of Pharmaceutical Sciences, The University of New Mexico College of Pharmacy, Albuquerque, New Mexico, USA.
8Department of Pathobiology and Diagnostic Investigation, Michigan State University, East Lansing, Michigan, USA.
9Department of Microbiology and Immunology, University of North Carolina at Chapel Hill, Chapel Hill, North Carolina, USA.
Address correspondence to: Padraig E. Hawkins, 7008 Marsico Hall, Chapel Hill, North Carolina 27599-7248, USA. Phone: 919.966.7064; Email: padraig_hawkins@med.unc.edu. Or to: Richard C. Boucher, 7008 Marsico Hall, 125 Mason Farm Road, Chapel Hill, North Carolina 27599-7248, USA. Phone: 919.966.7064; Email: richard_boucher@med.unc.edu.
Authorship note: PEH and SRL contributed equally to this work.
Find articles by Heine, L. in: PubMed | Google Scholar
1Marsico Lung Institute/Cystic Fibrosis Research Center, School of Medicine, University of North Carolina at Chapel Hill, Chapel Hill, North Carolina, USA.
2Department of Epidemiology, Gillings School of Global Public Health, University of North Carolina at Chapel Hill, Chapel Hill, North Carolina, USA.
3Competitive Labs, Hoover, Alabama.
4Department of Immunology Discovery, Genentech Inc., San Francisco, California, USA.
5Department of Food Science and Human Nutrition and
6Department of Pharmacology and Toxicology, Michigan State University, East Lansing, Michigan, USA.
7Department of Pharmaceutical Sciences, The University of New Mexico College of Pharmacy, Albuquerque, New Mexico, USA.
8Department of Pathobiology and Diagnostic Investigation, Michigan State University, East Lansing, Michigan, USA.
9Department of Microbiology and Immunology, University of North Carolina at Chapel Hill, Chapel Hill, North Carolina, USA.
Address correspondence to: Padraig E. Hawkins, 7008 Marsico Hall, Chapel Hill, North Carolina 27599-7248, USA. Phone: 919.966.7064; Email: padraig_hawkins@med.unc.edu. Or to: Richard C. Boucher, 7008 Marsico Hall, 125 Mason Farm Road, Chapel Hill, North Carolina 27599-7248, USA. Phone: 919.966.7064; Email: richard_boucher@med.unc.edu.
Authorship note: PEH and SRL contributed equally to this work.
Find articles by Harkema, J. in: PubMed | Google Scholar
1Marsico Lung Institute/Cystic Fibrosis Research Center, School of Medicine, University of North Carolina at Chapel Hill, Chapel Hill, North Carolina, USA.
2Department of Epidemiology, Gillings School of Global Public Health, University of North Carolina at Chapel Hill, Chapel Hill, North Carolina, USA.
3Competitive Labs, Hoover, Alabama.
4Department of Immunology Discovery, Genentech Inc., San Francisco, California, USA.
5Department of Food Science and Human Nutrition and
6Department of Pharmacology and Toxicology, Michigan State University, East Lansing, Michigan, USA.
7Department of Pharmaceutical Sciences, The University of New Mexico College of Pharmacy, Albuquerque, New Mexico, USA.
8Department of Pathobiology and Diagnostic Investigation, Michigan State University, East Lansing, Michigan, USA.
9Department of Microbiology and Immunology, University of North Carolina at Chapel Hill, Chapel Hill, North Carolina, USA.
Address correspondence to: Padraig E. Hawkins, 7008 Marsico Hall, Chapel Hill, North Carolina 27599-7248, USA. Phone: 919.966.7064; Email: padraig_hawkins@med.unc.edu. Or to: Richard C. Boucher, 7008 Marsico Hall, 125 Mason Farm Road, Chapel Hill, North Carolina 27599-7248, USA. Phone: 919.966.7064; Email: richard_boucher@med.unc.edu.
Authorship note: PEH and SRL contributed equally to this work.
Find articles by O’Neal, W. in: PubMed | Google Scholar
1Marsico Lung Institute/Cystic Fibrosis Research Center, School of Medicine, University of North Carolina at Chapel Hill, Chapel Hill, North Carolina, USA.
2Department of Epidemiology, Gillings School of Global Public Health, University of North Carolina at Chapel Hill, Chapel Hill, North Carolina, USA.
3Competitive Labs, Hoover, Alabama.
4Department of Immunology Discovery, Genentech Inc., San Francisco, California, USA.
5Department of Food Science and Human Nutrition and
6Department of Pharmacology and Toxicology, Michigan State University, East Lansing, Michigan, USA.
7Department of Pharmaceutical Sciences, The University of New Mexico College of Pharmacy, Albuquerque, New Mexico, USA.
8Department of Pathobiology and Diagnostic Investigation, Michigan State University, East Lansing, Michigan, USA.
9Department of Microbiology and Immunology, University of North Carolina at Chapel Hill, Chapel Hill, North Carolina, USA.
Address correspondence to: Padraig E. Hawkins, 7008 Marsico Hall, Chapel Hill, North Carolina 27599-7248, USA. Phone: 919.966.7064; Email: padraig_hawkins@med.unc.edu. Or to: Richard C. Boucher, 7008 Marsico Hall, 125 Mason Farm Road, Chapel Hill, North Carolina 27599-7248, USA. Phone: 919.966.7064; Email: richard_boucher@med.unc.edu.
Authorship note: PEH and SRL contributed equally to this work.
Find articles by
Livraghi-Butrico, A.
in:
PubMed
|
Google Scholar
|
1Marsico Lung Institute/Cystic Fibrosis Research Center, School of Medicine, University of North Carolina at Chapel Hill, Chapel Hill, North Carolina, USA.
2Department of Epidemiology, Gillings School of Global Public Health, University of North Carolina at Chapel Hill, Chapel Hill, North Carolina, USA.
3Competitive Labs, Hoover, Alabama.
4Department of Immunology Discovery, Genentech Inc., San Francisco, California, USA.
5Department of Food Science and Human Nutrition and
6Department of Pharmacology and Toxicology, Michigan State University, East Lansing, Michigan, USA.
7Department of Pharmaceutical Sciences, The University of New Mexico College of Pharmacy, Albuquerque, New Mexico, USA.
8Department of Pathobiology and Diagnostic Investigation, Michigan State University, East Lansing, Michigan, USA.
9Department of Microbiology and Immunology, University of North Carolina at Chapel Hill, Chapel Hill, North Carolina, USA.
Address correspondence to: Padraig E. Hawkins, 7008 Marsico Hall, Chapel Hill, North Carolina 27599-7248, USA. Phone: 919.966.7064; Email: padraig_hawkins@med.unc.edu. Or to: Richard C. Boucher, 7008 Marsico Hall, 125 Mason Farm Road, Chapel Hill, North Carolina 27599-7248, USA. Phone: 919.966.7064; Email: richard_boucher@med.unc.edu.
Authorship note: PEH and SRL contributed equally to this work.
Find articles by Pickles, R. in: PubMed | Google Scholar
1Marsico Lung Institute/Cystic Fibrosis Research Center, School of Medicine, University of North Carolina at Chapel Hill, Chapel Hill, North Carolina, USA.
2Department of Epidemiology, Gillings School of Global Public Health, University of North Carolina at Chapel Hill, Chapel Hill, North Carolina, USA.
3Competitive Labs, Hoover, Alabama.
4Department of Immunology Discovery, Genentech Inc., San Francisco, California, USA.
5Department of Food Science and Human Nutrition and
6Department of Pharmacology and Toxicology, Michigan State University, East Lansing, Michigan, USA.
7Department of Pharmaceutical Sciences, The University of New Mexico College of Pharmacy, Albuquerque, New Mexico, USA.
8Department of Pathobiology and Diagnostic Investigation, Michigan State University, East Lansing, Michigan, USA.
9Department of Microbiology and Immunology, University of North Carolina at Chapel Hill, Chapel Hill, North Carolina, USA.
Address correspondence to: Padraig E. Hawkins, 7008 Marsico Hall, Chapel Hill, North Carolina 27599-7248, USA. Phone: 919.966.7064; Email: padraig_hawkins@med.unc.edu. Or to: Richard C. Boucher, 7008 Marsico Hall, 125 Mason Farm Road, Chapel Hill, North Carolina 27599-7248, USA. Phone: 919.966.7064; Email: richard_boucher@med.unc.edu.
Authorship note: PEH and SRL contributed equally to this work.
Find articles by
Baric, R.
in:
PubMed
|
Google Scholar
|
1Marsico Lung Institute/Cystic Fibrosis Research Center, School of Medicine, University of North Carolina at Chapel Hill, Chapel Hill, North Carolina, USA.
2Department of Epidemiology, Gillings School of Global Public Health, University of North Carolina at Chapel Hill, Chapel Hill, North Carolina, USA.
3Competitive Labs, Hoover, Alabama.
4Department of Immunology Discovery, Genentech Inc., San Francisco, California, USA.
5Department of Food Science and Human Nutrition and
6Department of Pharmacology and Toxicology, Michigan State University, East Lansing, Michigan, USA.
7Department of Pharmaceutical Sciences, The University of New Mexico College of Pharmacy, Albuquerque, New Mexico, USA.
8Department of Pathobiology and Diagnostic Investigation, Michigan State University, East Lansing, Michigan, USA.
9Department of Microbiology and Immunology, University of North Carolina at Chapel Hill, Chapel Hill, North Carolina, USA.
Address correspondence to: Padraig E. Hawkins, 7008 Marsico Hall, Chapel Hill, North Carolina 27599-7248, USA. Phone: 919.966.7064; Email: padraig_hawkins@med.unc.edu. Or to: Richard C. Boucher, 7008 Marsico Hall, 125 Mason Farm Road, Chapel Hill, North Carolina 27599-7248, USA. Phone: 919.966.7064; Email: richard_boucher@med.unc.edu.
Authorship note: PEH and SRL contributed equally to this work.
Find articles by Boucher, R. in: PubMed | Google Scholar
Published July 7, 2026 - More info
JCI Insight. 2026;11(16):e203283. https://doi.org/10.1172/jci.insight.203283.
© 2026 Hawkins et al. This work is licensed under the Creative Commons Attribution 4.0 International License. To view a copy of this license, visit http://creativecommons.org/licenses/by/4.0/.
Received: December 8, 2025; Accepted: June 26, 2026

-
Results
Scnn1b-Tg mice exhibit reduced mortality, weight loss, and titers after SARS-CoV-2 MA10 infection compared with WT mice, but Scnn1b-Tg mice develop chronic pulmonary lesions. The 104 plaque-forming unit (PFU) inoculum produced no mortality in Scnn1b-Tg or WT mice, while 105 PFU produced 33% mortality selectively in the WT mice (Figure 1A). Scnn1b-Tg mice experienced less body weight loss and returned to starting body weight more quickly than WT, with both WT and Scnn1b-Tg mice returning to baseline weights at 30 days post-inoculation (dpi) (Figure 1B). From previous studies, WT (C57BL/6J) mice inoculated with SARS-CoV-2 MA10 typically reach peak viral lung titers 2 days after inoculation (21). Notably, viral titers were lower in Scnn1b-Tg mouse lungs at 2 dpi than in WT mice inoculated with both 104 and 105 PFU (Figure 1C). By 4 dpi, viral titers dropped in both Scnn1b-Tg and WT infected with 104 PFU and became similar (Figure 1C). Gross lung congestion scores for the 104 and 105 PFU inoculum cohorts were not different in WT versus Scnn1b-Tg mice at 2 and 4 dpi (Supplemental Figure 1A; supplemental material available online with this article; https://doi.org/10.1172/jci.insight.203283DS1).
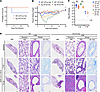 Figure 1
Scnn1b-Tg mice are protected from acute illness after SARS-CoV-2 MA10 but develop chronic disease. (A) Survival score with 105 PFU. (B) Percentage starting weight across time (dpi) for indicated experimental groups. Data were analyzed by mixed-effects analysis followed by Šidák’s multiple comparisons. At 104 PFU there was a statistically significant difference at 3 and 4 dpi; at 105 PFU there was a significant difference at 6 dpi. (C) Infectious virus lung titer as determined by plaque assay at either 2 dpi (2 viral inocula, 104 or 105 PFU) or 4 dpi (104 PFU dose only) in wild-type (WT) or Scnn1b-Tg mice. Dotted line represents the limit of virus detection (LoD). Error bars represent SEM. PFU, plaque-forming units. (D) Histopathologic analysis of lungs at baseline and at indicated times dpi. H&E, hematoxylin and eosin. “AB-PAS” indicates Alcian blue/periodic acid–Schiff staining with mucins appearing dark blue. Scale bars: 1 mm (low magnification) and 50 μm. Mixed-effects analysis followed by Šidák’s multiple comparisons. ANOVA followed by Kruskal-Wallis test. **P < 0.01.
Histologic features characteristic of the Scnn1b-Tg model, e.g., alveolar enlargement, increased airway Alcian blue/periodic acid–Schiff–positive (AB-PAS+) staining, and airway mucus plugging (20), were evident at baseline in Scnn1b-Tg mice (Figure 1D). Both WT and Scnn1b-Tg mice shared evidence of immune cell infiltration in the airway and parenchyma, alveolar congestion, and epithelial damage at 2 dpi (Figure 1D and Supplemental Figure 1, B and C). By 30 dpi, WT mice inoculated with 104 PFU MA10 showed no gross lung abnormalities (Figure 1D). However, 40% of Scnn1b-Tg mice exhibited histopathologic abnormalities in both airway and parenchymal regions (Figure 1D). The parenchymal lesions were characterized by an accumulation of hyper-eosinophilic intra-alveolar macrophages, hyperplastic alveolar epithelial cells, eosinophils, chitinase crystals, and Masson bodies (Supplemental Figure 2, A–E, and Supplemental Figure 3). The conducting airways proximal to parenchymal lesions exhibited evidence of goblet cell metaplasia, with increased intracellular mucins, as detected by AB-PAS staining (Figure 1D).
Scnn1b-Tg airway epithelium exhibits reduced SARS-CoV-2 infection. The tropism of MA10 for respiratory epithelia in mice has been previously described, with airway secretory cells and alveolar type 2 (AT2) cells exhibiting the greatest susceptibility to infection (22). In our studies, virus was detected in the airway and alveolar compartments of both WT and Scnn1b-Tg mice at 2 dpi after inoculation with 104 PFU (Figure 2A and Supplemental Figure 1, B and C). However, consistent with lower viral titers in Scnn1b-Tg mice (Figure 1C), morphometric quantification of virus infection by IHC for SARS-CoV-2 nucleocapsid (N) protein and RNA-ISH for spike mRNA revealed fewer viral particles in the lungs of Scnn1b-Tg versus WT (Figure 2, A–D, and Supplemental Figure 1, B and C). A 3-fold lower value of SARS-CoV-2 N protein was measured in the airways of Scnn1b-Tg mice at 2 dpi, with alveolar infection trending lower in the Scnn1b-Tg versus WT (Figure 2, B–D). The lower levels of SARS-CoV-2 staining in the Scnn1b-Tg mice were accompanied by preservation of secretory and AT2 cell markers (Scgb1a1 and Sftpc, respectively) in comparison with WT littermates, which exhibited a significantly reduced number of Sftpc+ AT2 cells upon MA10 infection (Supplemental Figure 4, A–C) (21).
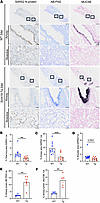 Figure 2
Airway epithelium of Scnn1b-Tg mice is resistant to infection with SARS-CoV-2 MA10. (A) Representative images of lungs from WT and Scnn1b-Tg mice at 2 dpi with 104 PFU of SARS-CoV-2 MA10. Shown are areas of alveolus and airway (labeled). Shown are IHC against SARS-CoV-2 nucleocapsid (N) protein and AB-PAS staining of mucins and IHC against MUC5B. Scale bars: 1 mm (low magnification) and 50 μm. (B–D) IHC of SARS-CoV-2 nucleocapsid protein was quantitated and normalized to lung tissue area for whole lung (B), airway (C), and alveolar tissue (D). (E and F) Airway lumen mucus was quantified using AB-PAS (E) and IHC of MUC5B (F) expressed as a percentage of the entire lumen area. Each dot represents results for one individual animal. **P < 0.01; ***P < 0.001. Student’s t test.
Accumulated proximal airway mucus in Scnn1b-Tg mice is associated with reduced airway epithelial SARS-CoV-2 infection. Because Scnn1b-Tg mice accumulate Muc5b-predominant mucus on proximal airway surfaces (23), a simple hypothesis to explain lower viral titers in Scnn1b-Tg mouse airways is the increased barrier protection provided by hyperconcentrated/adherent mucus (Figure 2A). Quantitation of mucus accumulation in Scnn1b-Tg versus WT mice revealed an increase in airway AB-PAS and Muc5b staining in Scnn1b-Tg mice (Figure 2, E and F). Notably, areas of airway epithelium underlying mucus plugs/plaques were predominantly free of viral antigen staining (Figure 2A). In contrast, bronchoalveolar duct junctions (BADJs) did not exhibit accumulation of mucus, and in this region there were no genotype-dependent differences in SARS-CoV-2 infection, and evidence of infection was obvious with a marked accumulation of inflammatory cells and epithelial cell debris in the airways of both WT and Scnn1b-Tg mice at 2 dpi (Supplemental Figure 1).
Baseline activation of proximal airway epithelial antiviral pathways in Scnn1b-Tg mice also associates with reduced SARS-CoV-2 infection. To further elucidate how the muco-inflamed airways of Scnn1b-Tg mice may limit MA10 infection, we investigated whether the airway epithelium of Scnn1b-Tg mice may be primed to inhibit MA10 infection. The presence of adherent airway mucus has been previously shown to trigger epithelial responses, e.g., activation of epithelial inflammatory pathways and immune cell chemotaxis, likely via retention of microbes, toxins, allergens (24), and/or epithelial hypoxia (25). Activation of these pathways could produce innate antiviral activities that contribute to decreased MA10 infectivity in the airways of Scnn1b-Tg mice versus WT mice.
To capture gene expression changes due to baseline differences and/or viral challenge, digital spatial profiling (DSP) was performed in selected cohorts of naive (baseline) and infected (2 dpi and 30 dpi) WT and Scnn1b-Tg mice (Supplemental Figure 5A). Regions of interest (ROIs) included proximal airway epithelia (defined as the mainstem bronchus to the first divisions of the intrapulmonary bronchi), distal BADJ regions, and alveolar parenchyma (diseased [chronic lesions] and non-diseased [normal-appearing histology]) (Supplemental Figure 5B). Note that all ROIs were collected in a single batch, but presentation of the data is considered by airway region, infection status, and time after infection. All DSP data used for each analysis are available in Supplemental Data File 1.
We first evaluated the baseline (pre-virus/naive) proximal airways where mucus plugs are found in the Scnn1b-Tg mice versus WT mice. Principal component analysis (PCA) of proximal airway ROIs at baseline (WT = not plugged vs. Scnn1b-Tg = plugged) showed distinct separation between genotypes (Figure 3A), with many differentially expressed genes (DEGs) (Supplemental Data File 2). Pathway analyses of DEGs detected upregulation of IFN-stimulated genes (ISGs), Il1b-stimulated genes, and host defense, concurrent with downregulated biological oxidation pathways, in Scnn1b-Tg mice as compared with WT mice (Figure 3B and Supplemental Data File 3). Upregulated ISG epithelial genes reported to be protective against SARS-CoV-2 infection included Serping1 and Ifitm1 (Supplemental Figure 6C) (26). Similarly, several epithelial host defense genes were upregulated in the proximal airways of Scnn1b-Tg mice that may also confer antiviral activities either directly, e.g., Plscr1 and Lcn2, or indirectly, e.g., Cd177 (activated neutrophil marker) (Supplemental Figure 6C) (27).
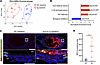 Figure 3
Airway epithelium of Scnn1b-Tg mice shows epithelial and immune priming that is protective against SARS-CoV-2 MA10. (A) PCA plot of gene expression values from spatial transcriptomics of proximal airway regions of interest (ROIs). All ROIs selected are displayed; red circles represent baseline plugged proximal airways of Scnn1b-Tg mice, and blue squares represent baseline proximal airways of WT mice. (B) Reactome and custom gene set enrichment analysis shown as normalized enrichment score of baseline Scnn1b-Tg-plugged versus baseline WT proximal airways. (C) Immunofluorescence for myeloperoxidase (MPO) and citrullinated histone H3 is shown in baseline, non-infected WT and Scnn1b-Tg-plugged mouse airways. Bottom panels represent higher magnification of inset. Scale bars: 100 μm and 50 μm (higher magnification). (D) Plot shows quantitation of MPO+ cells using immunofluorescence, displayed as numbers of cells per mm2 of airway. Each dot shows results for one individual animal. EPI, epithelium; AW, airway lumen; SM, submucosa. *P < 0.05. Student’s t test.
Baseline proximal airway luminal neutrophil accumulation is also associated with reduced SARS-CoV-2 infection in Scnn1b-Tg mice. We next considered whether the antiviral activities present in the proximal airways of the Scnn1b-Tg mice might also reflect the presence of inflammatory cells within the epithelium captured by the ROIs. Using immunofluorescence for neutrophil myeloperoxidase (MPO) and citrullinated histone H3, an increased number of neutrophils and neutrophil extracellular trap formations was observed within the airway epithelium of Scnn1b-Tg mice at baseline (Figure 3, C and D), consistent with previous reports (28, 29). Therefore, the increased abundance of neutrophils, which also express Ifitm1 (Human Protein Atlas; www.proteinatlas.org) (30), may also contribute to the reduced infection of the airway epithelium of Scnn1b-Tg mice with MA10 (31).
Early (2 dpi) transcriptional responses of proximal airways to MA10 infection are qualitatively similar and virus infection–proportionate in Scnn1b-Tg mice and WT mice. While baseline differences in the proximal airways of Scnn1b-Tg and WT mice were significant as described above (Figure 2D), PCA analysis indicated that the proximal airways of WT and Scnn1b-Tg mice exhibited similar transcriptional responses to MA10 infection at 2 dpi (Supplemental Figure 6A), largely driven by strong upregulation of ISGs, cytokine signaling, cell senescence, and complement cascade genes and decreases in biological oxidations (Supplemental Figure 6B). Notably, while still robust, the ISG response in the proximal airways of Scnn1b-Tg mice was overall reduced in comparison with WT mice (Supplemental Figure 6D), likely reflecting the lower viral burden as measured by titers (Figure 1C).
BADJ regions in Scnn1b-Tg and WT mice at baseline and 2 dpi. In contrast to the proximal airways, ROIs selected from BADJs, which were not mucus-plugged in the Scnn1b-Tg mice, showed minimal transcriptional differences between genotypes both at baseline and at 2 dpi (Supplemental Figure 7).
Airway mucous cell metaplasia with Th2 skewing develops in MA10-infected Scnn1b-Tg mice in regions with evidence of chronic disease at 30 dpi. Histologically, airways of WT mice recovered from the acute lung injury by 30 dpi (Figure 1D and Figure 4A). In contrast, a proportion (40%) of Scnn1b-Tg mice exhibited regions of goblet cell metaplasia, which were typically within, or proximal to, the parenchymal lesions identified in Scnn1b-Tg mice at 30 dpi (Figure 1D and Figure 4A). In these regions, airway epithelia were hyperplastic with characteristic AB-PAS+ goblet cells with increased MUC5AC and decreased MUC5B expression as assessed by immunofluorescence (Figure 4A).
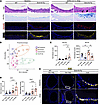 Figure 4
SARS-CoV-2 MA10 infection induces MUC5AC-rich goblet cell metaplasia in the airways of Scnn1b-Tg mice at 30 dpi. (A) Histopathologic analysis of WT and Scnn1b-Tg mouse airways in non-infected mice (baseline) and at 30 dpi. MUC5AC and MUC5B are visualized after IHC. H&E, hematoxylin and eosin; AB-PAS, Alcian blue/periodic acid–Schiff with mucins appearing dark blue. Black arrowheads show intracellular YM1/YM2. Scale bars: 100 μm. (B) PCA plot of gene expression values from GeoMx spatial transcriptomics of proximal airways is shown for the indicated experimental groups. All ROIs selected are displayed, with each color representing an experimental group and symbols representing genotype. (C) Q3-normalized counts representing RNA expression of Muc5ac and Muc5b across proximal airway ROIs in WT and Scnn1b-Tg mice for naive and 30 dpi. (D) Q3-normalized counts representing gene expression of Aqp3 and Krt5 across proximal airway ROIs in WT and Scnn1b-Tg mice for naive (baseline) and 30 dpi. (E) IHC for KRT5 in representative airways of WT and Scnn1b-Tg mice, naive and at 30 dpi. Scale bars: 100 μm for all. Each dot in bar plots of C and D shows results for one individual animal. *P < 0.05; **P < 0.01; ****P < 0.0001. ANOVA with Tukey’s multiple-comparison test.
PCA analysis comparing WT and Scnn1b-Tg proximal airways at baseline or at 30 dpi identified separation of 30 dpi from baseline for both WT and Scnn1b-Tg, suggesting incomplete recovery from infection for both cohorts (Figure 4B). We specifically focused on the characteristics of the mucus metaplastic lesions in the Scnn1b-Tg mice. As visualized in a heatmap of DEGs, genes belonging to cluster 2 were uniquely upregulated in diseased Scnn1b-Tg airways at 30 dpi (Supplemental Figure 6B and Supplemental Data File 2). This cluster included Muc5ac (Figure 4C), genes related to increased mucin secretion (e.g., Ern2), and genes associated with chitinase production (Chil3/Chil4) (Supplemental Figure 8A), supporting the hypothesis that a type 2 inflammatory stimulus triggered mucous secretory cell metaplasia. As predicted from the IHC, MUC5B was upregulated in these diseased airways (Figure 4C). RNA-ISH confirmed upregulation of the chitinases Chil3 and Chil4 and colocalized their expression with the airway secretory cell marker Scgb1a1 (Supplemental Figure 8B).
Krt5 and Aqp3, markers of airway basal cells, were also upregulated in Scnn1b-Tg airways compared with WT at 30 dpi (Figure 4D and Supplemental Data File 1), indicating an epithelial proliferative response. Validating this finding, IHC identified more KRT5+ basal cells in Scnn1b-Tg compared with WT proximal airways at baseline, and the KRT5+ population was even more abundant in the diseased airways of Scnn1b-Tg mice at 30 dpi (Figure 4E).
MA10 infection results in development of morphologic features of chronic (30 dpi) organizing eosinophilic pneumonia in Scnn1b-Tg mice. The 30 dpi airway data identified a Th2-skewed response associated with the chronic lesions. A similar investigation of the parenchymal lesions was conducted to explore the mechanisms mediating lesion development (Figure 5A). The lesions, which varied in size (Figure 5B), were shown to contain major basic protein (Figure 5, A and D), which marked eosinophils, and the large hyper-eosinophilic macrophages (Supplemental Figures 2 and 3) were shown to contain ARG1, a marker of alternative macrophage activation (Figure 5, A and C). Both eosinophils and alternatively activated macrophages persisted in these lesions at 60 dpi (Supplemental Figure 9A). The lesion also demonstrated fibroblast proliferation, as measured by IHC for α-smooth muscle actin (α-SMA), and focal collagen deposition, as indexed by increased Picrosirius red histochemical stain and COL1A1 IHC, consistent with remodeling of alveolar structures in these lesions (Supplemental Figure 9B). α-SMA–stained myofibroblasts occasionally accumulated within the alveolar spaces or terminal bronchioles reminiscent of Masson bodies, a histologic feature characteristic of organizing pneumonia (Supplemental Figures 2 and 3 and Supplemental Figure 9E). Notably, there was no evidence in Scnn1b-Tg mice for (a) increased numbers of CD4+ and CD8+ T cells and CD45R+ B cells; or (b) differences in iNOS+ cells (Supplemental Figure 10A), despite an increase in tertiary lymphoid aggregates (Supplemental Figure 10B).
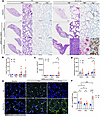 Figure 5
SARS-CoV-2 MA10 infection causes variable levels of chronic eosinophilic pneumonia in Scnn1b-Tg mice. (A) Histopathologic analysis of lungs in the experimental groups (non-infected = baseline, 2 and 30 dpi for WT and Scnn1b-Tg mice). H&E, hematoxylin and eosin. MBP indicates IHC against major basic protein, a marker of eosinophils. Arg1 indicates IHC against arginase-1, a marker of M2 macrophage activation. Scale bars: 1 mm (low magnification) and 50 μm. (B) Quantitation of the percentage of lung tissue affected by chronic eosinophilic pneumonia. (C) Arg1 area quantified and normalized to lung area. (D) Eosinophil count based on IHC against MBP and normalized to whole lung area. (E) Immunofluorescence of pro–surfactant protein C and SARS-CoV-2 nucleocapsid protein shown over a time course of infection in WT and Scnn1b-Tg mice. DAPI staining nuclei in dark blue. Scale bars: 100 μm. (F) Quantitation of pro–surfactant protein C–positive cells per total DAPI area. Dots in bar graphs represent individual animals (B–D and F). *P < 0.05; **P < 0.01; ***P < 0.001; ****P < 0.0001. Mixed-effects analysis, uncorrected Fisher’s least significant difference.
The long-term (30-day) responses to MA10 infection in Scnn1b-Tg mice contrasted with phenotypes reported for aged BALB/c mice, which develop subpleural foci of fibrosis and persistence of KRT8+ cells with reduced numbers of Sftpc+ cells within areas of fibrosis (18). Notably, in Scnn1b-Tg mice, there was an approximately 2-fold increase in AT2 cell abundance in the chronically diseased regions of Scnn1b-Tg mice compared with WT mice at 30 dpi, as measured by pro–surfactant protein C (pro-SPC) IHC (Figure 5, E and F). A small proportion of these AT2 cells colocalized with the marker of proliferation Ki67, suggesting that the alveolar lesion is characterized by increased proliferating cells, some being AT2 cells (Supplemental Figure 11, A and B). Overall, these findings support the characterization of this lesion as an organizing, type 2 inflammatory parenchymal response consistent with pathologic description of chronic eosinophilic pneumonia (CEP).
Alveolar immune responses to MA10 infection differed already between Scnn1b-Tg and WT mice at 2 dpi. We again used GeoMX DSP to investigate the mechanism by which the Scnn1b-Tg alveolar regions were susceptible to the development of CEP after SARS-CoV-2 infection. PCA plots and heatmaps of DEGs among the ROIs selected across genotypes, dpi, and chronic disease regions highlighted distinct differences across all experimental groups (Supplemental Figure 12, A and B, and Supplemental Data File 2). In contrast to proximal airways at 2 dpi (Figure 2C), genotype-specific differences were seen in the alveoli at 2 dpi (Figure 6A). Pathways reflecting increased neutrophil chemoattractants, myeloid leukocyte activation, and M1 macrophage markers were upregulated in Scnn1b-Tg compared with WT, reflecting increased expression of inflammatory markers such as Ccl2 and Il1b (Figure 6, B and C, Supplemental Figure 12B, and Supplemental Data File 3). These increased inflammatory signatures occurred despite the reduced expression of viral proteins at 2 dpi in Scnn1b-Tg mice (Figure 2B). In parallel, the ISG responses trended toward a reduction in Scnn1b-Tg mice (P = 0.06; Supplemental Figure 12D), again consistent with lower SARS-CoV-2 Orf1ab transcripts in the alveolar ROIs from Scnn1b-Tg mice (Supplemental Figure 12E) and viral IHC quantitation in the alveoli (Figure 2, A and B).
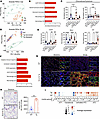 Figure 6
Transcriptional analysis reveals activated AT2 cells and Th2-skewed macrophages at baseline. (A) PCA plot of gene expression values from GeoMx spatial transcriptomics of alveolar ROIs from 2 dpi. All ROIs selected are displayed, with green, open circles representing Scnn1b-Tg mice and orange, open squares representing WT. (B) Normalized enrichment scores and adjusted P values for selected gene pathways in alveolar ROIs of Scnn1b-Tg mice versus WT mice at 2 dpi. (C) Q3-normalized counts representing gene expression of Ccl2 and Il1b across alveolar ROIs at 2 and 30 dpi in WT and Scnn1b-Tg mice. For WT mice, all alveoli (ALV) returned to normal by 30 dpi, but in Scnn1b-Tg mice, 2 types of alveolar ROIs were selected, those that appeared normal and those that appeared diseased (Dx). (D) PCA plot of gene expression from alveolar ROIs from 30 dpi. All ROIs selected are displayed for each experimental group. (E) Q3-normalized counts representing gene expression of Lamp3, Rtkn2, and Il33 across alveolar ROIs. (F) Normalized enrichment scores for selected gene pathways in alveolar ROIs of Scnn1b-Tg mice versus WT mice at 30 dpi. (G) IHC of IL-33 and pro–surfactant protein C from WT and Scnn1b-Tg at 30 dpi and naive mice. DAPI is shown in dark blue. Scale bars: 200 μm and 100 μm (high magnification). (H) RNA-ISH of Il33 in baseline lungs of WT and Scnn1b-Tg mice. Quantitation of RNA-ISH Il33 signal in naive mouse lungs. Scale bar: 200μm. (I) Dot plot showing distal lung epithelial markers for WT and Scnn1b-Tg mice generated from scRNA-seq data. Dot size indicates percentage expression and dot color average expression. *P < 0.05; **P < 0.01; ****P < 0.0001. ANOVA with Tukey’s multiple-comparison test. Student’s t test.
Notably, there were no genotype-specific differences for AT2 (Sftpa, Sftpc, Lamp3), AT1 (Rtkn2, Ager, Hopx), or transitional (Cdkn1a, Krt8) cell markers in early infection at 2 dpi, with both Scnn1b-Tg and WT mice losing AT2 and AT1 cell-type identity markers at 2 dpi and both showing increased transitional cells (Supplemental Figure 12C and Supplemental Data File 1).
Multiplex immunoassays were performed to validate DSP RNA-based inflammatory responses in the alveoli of Scnn1b-Tg and WT mice at 2 dpi. The protein level of CCL2, a monocyte chemoattractant (32), in whole-lung homogenates showed a trend (P = 0.0519) to be increased at this time point (Supplemental Figure 13B). As predicted from the increase in CCL2 at both the mRNA and protein levels, Scnn1b-Tg mice exhibited a greater intrapulmonary influx of Iba1+ inflammatory monocytes/interstitial macrophages at 2 dpi than WT mice (Supplemental Figure 13C). Overall, the 2 dpi data suggest that, despite a trend toward reduced viral load in the alveolar space, Scnn1b-Tg mice exhibited more robust acute inflammatory responses to viral infection compared with WT mice, which could explain their propensity toward development of the CEP lesions by 30 dpi.
Late (30 dpi) transcriptional response to MA10 in Scnn1b-Tg alveoli demonstrates a disorganized alveolar architecture. Consistent with the heterogeneity of alveolar disease observed histologically in Scnn1b-Tg at 30 dpi, PCA analysis robustly separated diseased alveoli from histologically normal alveoli in Scnn1b-Tg mice at 30 dpi (Figure 6A). Diseased alveolar regions exhibited (a) increases in gene signatures of AT2 cells (Lamp3) and alveolar transitional cells (Krt8); (b) reductions in AT1 cell signature genes (Rtkn2); and (c) activated AT2 cell marker genes, including Il33 (Figure 6E, Supplemental Figure 12C, and Supplemental Data File 1). Pathway analyses revealed upregulation of pathways associated with surfactant metabolism and transitional cells (damage-associated transient progenitors, pre-alveolar transitional state, alveolar differentiation intermediate [DATP-PATS-ADI]), extracellular matrix (ECM) organization, and adaptive immune response in diseased Scnn1b-Tg chronic alveolar lesions (Figure 6F and Supplemental Data File 3). This pattern was juxtaposed to downregulation of blood vessel morphogenesis and smooth muscle contraction (Supplemental Figure 12B). The increased abundance of SFTPC+ cells expressing IL-33 was confirmed using immunofluorescence (Figure 6H).
Predisposition of Scnn1b-Tg mice to CEP: single-cell RNA transcriptional profiling reveals evidence of activated AT2 cells and Th2-skewed macrophages at baseline in Scnn1b-Tg mice. The presence of CEP in Scnn1b-Tg mice but not WT mice suggests that Scnn1b-Tg mice exhibit a preexisting susceptibility to this condition. Single-cell RNA sequencing (scRNA-seq) analysis of epithelial cell–enriched whole-lung homogenates from baseline Scnn1b-Tg and WT mice was performed to test this hypothesis. A total of 27,169 cells were obtained, and graph-based clustering produced 37 distinct clusters, including epithelial, immune, and stromal cell types (see Methods) (Supplemental Figure 13A). Uniform manifold approximation and projection (UMAP) did not reveal gross separations of cell clusters by genotypes (Supplemental Figure 14, A and B), with both genotypes represented in all cell clusters.
We next specifically analyzed the alveolar cell clusters. A number of mouse scRNA-seq studies have identified an AT2 cell population that emerges early in response to injury, termed “activated AT2 cells,” cells thought to have entered a transitional state that facilitates the generation of AT1 cells (33). Cells that exhibit incomplete transitions from AT2 to AT1 cells, i.e., transitional cells, have been identified in human idiopathic pulmonary fibrosis and postmortem lungs from individuals with COVID-19 (34). AT2 cells from baseline Scnn1b-Tg mice exhibited increased expression of marker genes that define activated AT2 cells (e.g., Il33, Lrg1, Cxcl17, Slpi) (Figure 6I), suggesting that Scnn1b-Tg AT2 cells are activated at baseline. RNA-ISH confirmed increased expression of Il33 in baseline Scnn1b-Tg as compared with WT mice (Figure 5F). We speculate that activated AT2 cells mediate the propensity of Scnn1b-Tg mice to develop CEP long after MA10 infection.
Our scRNA-seq analyses also revealed differences in alveolar macrophages (AMs) between baseline WT and Scnn1b-Tg mice (Supplemental Figure 13C). These changes are consistent with findings from two prior studies describing the transcriptional state of Scnn1b-Tg AMs (35, 36). Genes differentiating Scnn1b-Tg from WT macrophages included (a) upregulated genes common to both previous reports (Scd1, Igf1, Cd63, Epas1); (b) upregulated M2 macrophage genes (Atf3, Cd200, Cd36, Trem2); and (c) downregulated M1 macrophage genes (Cd69, Cxcl2, Il1b, Tlr2, Tnf) (Supplemental Figure 14D). The primed nature of AMs in Scnn1b-Tg may also contribute to the CEP phenotype observed in Scnn1b-Tg mice.
Preventative targeting of the IL-33/ST2 axis reduces MA10-induced CEP in Scnn1b-Tg mice. Based on our finding of upregulation of IL-33 in baseline and post-MA10-infected Scnn1b-Tg diseased lungs (Figure 6, G and H), a monoclonal antibody against the canonical IL-33 receptor (ST2) was tested for efficacy in a pretreatment protocol (Supplemental Figure 15A). The anti-ST2 monoclonal antibody pretreatment protocol had no impact on weight loss, viral titer, or an array of cytokines in either genotype at 2 dpi (Supplemental Figure 15, B–D). However, infected Scnn1b-Tg mice given anti-ST2 monoclonal antibodies exhibited a reduction in the magnitude of CEP lesions as compared with vehicle-treated Scnn1b-Tg mice (Figure 7, A and B). A trend toward reduced accumulations of alternatively activated macrophages but not eosinophils was noted (Figure 7C and Supplemental Figure 15E). Hyperplasia of IL-33+ AT2 cells with upregulated IL-33 expression persisted in the presence of the anti-ST2 monoclonal antibody (Figure 7, A and D).
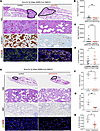 Figure 7
Therapeutic benefit of IL-33 pathway inhibition and prednisone treatment. (A) Representative histologic images of lung in Scnn1b-Tg mice given vehicle or anti-ST2 monoclonal antibody at 30 dpi. H&E, hematoxylin and eosin. Arginase-1 indicates DAB-labeling (brown color) IHC for arginase-1. SPC/IL-33 indicates IHC (fluorescent) for pro–surfactant protein C and IL-33. Scale bars: 1 mm (low magnification) and 200 μm. (B) Quantitation of the area of diseased lung per total lung area. (C) Quantitation of arginase-1 IHC–positive area per total lung area. (D) Quantitation of IL-33+ area per lung area. (E) Representative histologic images of lung in Scnn1b-Tg mice treated with vehicle or oral prednisone at 30 dpi. H&E, hematoxylin and eosin. MBP indicates IHC (red) for major basic protein. SPC/IL-33 indicates IHC (fluorescent) for pro–surfactant protein C and IL-33. Scale bars: 1 mm (low magnification) and 100 μm. (F) Quantitation of the area of eosinophilic pneumonia per total lung area. (G) Quantitation of arginase-1 IHC–positive area per total lung area. (H) Quantitation of IL-33+ area per lung area. *P < 0.05; **P < 0.01. Student’s t test.
Post-infection corticosteroid administration is also effective in treating MA10-induced Scnn1b-Tg eosinophilic pneumonia. Scnn1b-Tg and WT mice infected with MA10 were fed enteral prednisone (37) or vehicle control, commencing at 7 dpi (Supplemental Figure 16A). Serum prednisone concentrations were confirmed by ultra-high-performance liquid chromatography/mass spectrometry to be within a range that has previously been reported in mice (Supplemental Figure 16B) (37). Scnn1b-Tg mice treated with control diet exhibited greater weight gain from 9 dpi to 30 dpi than Scnn1b-Tg mice that received prednisone diet (Supplemental Figure 16C). Compared with vehicle treatment, prednisone reduced the area of diseased lung in Scnn1b-Tg mice more than 10-fold (Figure 7, E and F), significantly reduced the abundance of eosinophils (Figure 7G), and reduced expression of IL-33 in AT2 cells (Figure 7H and Supplemental Figure 16D). The reduction in lesion area was also accompanied by fewer lesions that were positive for arginase-1 (Supplemental Figure 16D).


