
Research ArticleAIDS/HIVImmunology
Open Access |  10.1172/jci.insight.202628
Granulocytic myeloid–derived suppressor cells sustain HIV reservoirs by inhibiting viral reactivation via arginase 1–mediated mechanisms
Ana Gallego-Cortés,1 Judith Grau-Expósito,1 Irene Mota-Gómez,1 Aleix Benitez-Martinez,1 Josep Castellvi,2 Jordi Navarro,1 Adrian Curran,1 Joaquin Burgos,1 Paula Suanzes,1 Vicenç Falcó,1 Meritxell Genescà,1 and Maria J. Buzon1
1Infectious Diseases Department, Hospital Universitari Vall d’Hebron (HUVH), Vall d’Hebron Institut de Recerca (VHIR), Universitat Autònoma de Barcelona, Barcelona, Spain.
2Department of Pathology, HUVH, Barcelona, Spain.
Address correspondence to: Maria J. Buzon, Passeig de la Vall d′Hebron 119-129, 08035 Barcelona, Spain. Phone: 34.608501402; Email: mariajose.buzon@vhir.org.
Find articles by Gallego-Cortés, A. in: PubMed | Google Scholar
1Infectious Diseases Department, Hospital Universitari Vall d’Hebron (HUVH), Vall d’Hebron Institut de Recerca (VHIR), Universitat Autònoma de Barcelona, Barcelona, Spain.
2Department of Pathology, HUVH, Barcelona, Spain.
Address correspondence to: Maria J. Buzon, Passeig de la Vall d′Hebron 119-129, 08035 Barcelona, Spain. Phone: 34.608501402; Email: mariajose.buzon@vhir.org.
Find articles by Grau-Expósito, J. in: PubMed | Google Scholar
1Infectious Diseases Department, Hospital Universitari Vall d’Hebron (HUVH), Vall d’Hebron Institut de Recerca (VHIR), Universitat Autònoma de Barcelona, Barcelona, Spain.
2Department of Pathology, HUVH, Barcelona, Spain.
Address correspondence to: Maria J. Buzon, Passeig de la Vall d′Hebron 119-129, 08035 Barcelona, Spain. Phone: 34.608501402; Email: mariajose.buzon@vhir.org.
Find articles by Mota-Gómez, I. in: PubMed | Google Scholar
1Infectious Diseases Department, Hospital Universitari Vall d’Hebron (HUVH), Vall d’Hebron Institut de Recerca (VHIR), Universitat Autònoma de Barcelona, Barcelona, Spain.
2Department of Pathology, HUVH, Barcelona, Spain.
Address correspondence to: Maria J. Buzon, Passeig de la Vall d′Hebron 119-129, 08035 Barcelona, Spain. Phone: 34.608501402; Email: mariajose.buzon@vhir.org.
Find articles by Benitez-Martinez, A. in: PubMed | Google Scholar
1Infectious Diseases Department, Hospital Universitari Vall d’Hebron (HUVH), Vall d’Hebron Institut de Recerca (VHIR), Universitat Autònoma de Barcelona, Barcelona, Spain.
2Department of Pathology, HUVH, Barcelona, Spain.
Address correspondence to: Maria J. Buzon, Passeig de la Vall d′Hebron 119-129, 08035 Barcelona, Spain. Phone: 34.608501402; Email: mariajose.buzon@vhir.org.
Find articles by Castellvi, J. in: PubMed | Google Scholar
1Infectious Diseases Department, Hospital Universitari Vall d’Hebron (HUVH), Vall d’Hebron Institut de Recerca (VHIR), Universitat Autònoma de Barcelona, Barcelona, Spain.
2Department of Pathology, HUVH, Barcelona, Spain.
Address correspondence to: Maria J. Buzon, Passeig de la Vall d′Hebron 119-129, 08035 Barcelona, Spain. Phone: 34.608501402; Email: mariajose.buzon@vhir.org.
Find articles by Navarro, J. in: PubMed | Google Scholar
1Infectious Diseases Department, Hospital Universitari Vall d’Hebron (HUVH), Vall d’Hebron Institut de Recerca (VHIR), Universitat Autònoma de Barcelona, Barcelona, Spain.
2Department of Pathology, HUVH, Barcelona, Spain.
Address correspondence to: Maria J. Buzon, Passeig de la Vall d′Hebron 119-129, 08035 Barcelona, Spain. Phone: 34.608501402; Email: mariajose.buzon@vhir.org.
Find articles by Curran, A. in: PubMed | Google Scholar
1Infectious Diseases Department, Hospital Universitari Vall d’Hebron (HUVH), Vall d’Hebron Institut de Recerca (VHIR), Universitat Autònoma de Barcelona, Barcelona, Spain.
2Department of Pathology, HUVH, Barcelona, Spain.
Address correspondence to: Maria J. Buzon, Passeig de la Vall d′Hebron 119-129, 08035 Barcelona, Spain. Phone: 34.608501402; Email: mariajose.buzon@vhir.org.
Find articles by Burgos, J. in: PubMed | Google Scholar
1Infectious Diseases Department, Hospital Universitari Vall d’Hebron (HUVH), Vall d’Hebron Institut de Recerca (VHIR), Universitat Autònoma de Barcelona, Barcelona, Spain.
2Department of Pathology, HUVH, Barcelona, Spain.
Address correspondence to: Maria J. Buzon, Passeig de la Vall d′Hebron 119-129, 08035 Barcelona, Spain. Phone: 34.608501402; Email: mariajose.buzon@vhir.org.
Find articles by
Suanzes, P.
in:
PubMed
|
Google Scholar
|

1Infectious Diseases Department, Hospital Universitari Vall d’Hebron (HUVH), Vall d’Hebron Institut de Recerca (VHIR), Universitat Autònoma de Barcelona, Barcelona, Spain.
2Department of Pathology, HUVH, Barcelona, Spain.
Address correspondence to: Maria J. Buzon, Passeig de la Vall d′Hebron 119-129, 08035 Barcelona, Spain. Phone: 34.608501402; Email: mariajose.buzon@vhir.org.
Find articles by Falcó, V. in: PubMed | Google Scholar
1Infectious Diseases Department, Hospital Universitari Vall d’Hebron (HUVH), Vall d’Hebron Institut de Recerca (VHIR), Universitat Autònoma de Barcelona, Barcelona, Spain.
2Department of Pathology, HUVH, Barcelona, Spain.
Address correspondence to: Maria J. Buzon, Passeig de la Vall d′Hebron 119-129, 08035 Barcelona, Spain. Phone: 34.608501402; Email: mariajose.buzon@vhir.org.
Find articles by Genescà, M. in: PubMed | Google Scholar
1Infectious Diseases Department, Hospital Universitari Vall d’Hebron (HUVH), Vall d’Hebron Institut de Recerca (VHIR), Universitat Autònoma de Barcelona, Barcelona, Spain.
2Department of Pathology, HUVH, Barcelona, Spain.
Address correspondence to: Maria J. Buzon, Passeig de la Vall d′Hebron 119-129, 08035 Barcelona, Spain. Phone: 34.608501402; Email: mariajose.buzon@vhir.org.
Find articles by
Buzon, M.
in:
PubMed
|
Google Scholar
|
Published July 21, 2026 - More info
JCI Insight. 2026;11(16):e202628. https://doi.org/10.1172/jci.insight.202628.
© 2026 Gallego-Cortés et al. This work is licensed under the Creative Commons Attribution 4.0 International License. To view a copy of this license, visit http://creativecommons.org/licenses/by/4.0/.
Received: November 18, 2025; Accepted: July 7, 2026


-
Results
Differential regulation of MDSC during treated and untreated HIV infection. We first compared the frequency of G-MDSCs and M-MDSCs within the peripheral blood of 11 healthy donors (HD), 13 viremic PWH (VIR), and 26 PWH receiving ART with undetectable viremia (ART) (participants HD#1–11, VIR#1–13, and ART#1–26, Supplemental Table 1; supplemental material available online with this article; https://doi.org/10.1172/jci.insight.202628DS1). Flow cytometry was conducted with a panel of markers comprising CD3, CD4, CD33, CD11b, HLA-DR, CD14, and CD15. Unsupervised clustering analysis (FlowSOM) identified 14 distinct clusters shared across all cohorts (Figure 1A) based on the expression patterns of the aforementioned markers (Figure 1B and Supplemental Figure 1). Clusters C06 and C07 represented G-MDSCs (CD3–CD4–CD33midCD11b+HLA-DRloCD14–CD15+) and M-MDSCs (CD3–CD4–CD33hiCD11b+HLA-DRloCD14+CD15–), respectively. Clusters C01 and C03 were attributed to resting (HLA-DR–) and activated (HLA-DR+) CD4+ T cell populations (CD3+CD4+), while clusters C02 and C04 delineated the corresponding CD8+ T cell subsets (CD3+CD4–). Cluster C08 was designated as monocytes (CD33hiCD11b+HLA-DR+CD14+), and 3 supplementary subsets of CD33+ myeloid cells were discerned: C10 (CD4midCD33+HLA-DR+), C11 (CD4midCD33midHLA-DR+), and C13 (CD33midCD11bmid). Nonetheless, the remaining 3 clusters, namely C05 (CD3+CD11bmid), C12 (negative for all [NFA]) and C14 (CD11bmid), could not be conclusively characterized due to a lack of lineage-specific markers. As expected, significant differences were observed in the proportions of resting and activated lymphocytes between cohorts (Figure 1C and Supplemental Figure 2). Importantly, elevated frequencies of both MDSC subpopulations were evident in the VIR and ART cohorts relative to the HD group (Figure 1C). Specifically, G-MDSCs (C06) exhibited an increase exceeding 5-fold in the VIR cohort and above 10-fold in the ART group (medianVIR = 0.13% and medianART = 0.27%) relative to the HD group (medianHD = 0.02%) (Figure 1D). When comparing the 3 cohorts, statistical significance was only achieved between the ART and HD groups (Figure 1D). Regarding M-MDSCs (C07), PWH displayed nearly doubled proportions compared with HD. The highest frequency was observed in the ART group (medianART = 0.61%), followed by the VIR cohort (medianVIR = 0.59%), with the HD group exhibiting the lowest frequency (medianHD = 0.35%) (Figure 1E). Interestingly, while a significant positive correlation was observed between both MDSC subsets in the VIR group (rVIR = 0.5659, PVIR = 0.0473), no such correlation was found in the ART cohort (rART = 0.1788, PART = 0.3821), suggesting different mechanisms driving G-MDSC and M-MDSC expansion during treatment (Figure 1, F and G). Finally, we determined whether an increase in MDSCs in PWH was associated to changes in the proportion of the other identified clusters (Figure 1F). Notably, both MDSC subsets negatively correlated with resting CD4+ T cells (C01) in the VIR group (rG-MDSCs = –0.5385, PG-MDSCs = 0.0611; rM-MDSCs = –0.6099, PM-MDSCs = 0.0302) (Figure 1H), although such correlations were not observed in the ART group (rG-MDSCs = –0.1084, PG-MDSCs = 0.5982; rM-MDSCs= –0.1355, PM-MDSCs = 0.5107) (Figure 1I). Conversely, in the ART cohort, G-MDSCs and/or M-MDSCs positively correlated with other myeloid cells, including monocytes (C08) (Figure 1J), as well as clusters C10 (Figure 1K) and C11 (Figure 1L).
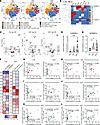 Figure 1
Phenotypic characterization of MDSCs in PWH and HD. (A) Opt-SNE plots displaying the distribution of the 14 clusters identified within live PBMCs from HD, VIR, and ART cohorts. G-MDSCs (C06) and M-MDSCs (C07) are highlighted. (B) Heatmap illustrating the Mean Fluorescence Intensity (MFI) of CD3, CD4, CD33, CD11b, HLA-DR, CD14, and CD15 markers across clusters. MDSCs were defined as CD3– CD11b+ CD33+ HLA-DR–/lo cells. G-MDSCs and M-MDSCs were distinguished based on CD33, CD14, and CD15 expression. (C) Volcano plots showing significant differences in cluster frequencies between HD, VIR, and ART cohorts. (D and E) Violin plots displaying the frequency of G-MDSCs (D) and M-MDSCs (E) within total live PBMCs across groups. Median values with quartiles are represented and statistical comparisons were performed using a 2-sided Kruskal-Wallis test with Dunn’s post hoc correction. (F–L) Spearman correlation analyses displaying relationships between G-MDSC and M-MDSC subsets and the remaining identified clusters (F); each other in the VIR and ART groups (G); CD4+ T cells (C01) in VIR (H) and ART (I) individuals; and Monocytes (C08) (J), CD4midCD33+HLA-DR+ cells (C10) (K), and CD4midCD33midHLA-DR+ cells (C11) (L) in the ART cohort. All panels include data from healthy donors (HD, n = 11), viremic PWH (VIR, n = 13), and ART-suppressed PWH (ART, n = 26). *P < 0.05, ***P < 0.001, and ****P < 0.0001. Source data are provided as a Source Data file.
Overall, we found that productive HIV infection is directly associated with an expansion of MDSCs that persists throughout treated infection. This increase correlates with the CD4+ T cell decline characteristic of untreated HIV infection; whereas it coincides with a rise in the frequencies of other myeloid populations during treated infection, yet not with CD4+ T cells. This underscores a complex, treatment-dependent interplay between MDSCs and various immune cell populations during HIV infection.
MDSCs are present in lymph nodes from PWH and are associated with an immunosuppressive microenvironment. Next, we investigated whether MDSCs could infiltrate and reside within immune-privileged sites and perpetuate HIV persistence. Among these sites, lymph nodes (LNs) serve as crucial HIV sanctuaries and reservoirs due to a distinctive cellular compartmentalization that facilitates the establishment of a persistent infection (69, 70). To discern the role of MDSCs within these lymphoid compartments, we examined the presence and localization of CD33+ cells, a validated marker for identifying MDSCs in tissues (71–74), alongside the HIV protein p24 via fluorescence immunostaining in anatomically intact LN sections from VIR and ART individuals (participants VIR#14–16 and ART#50; Supplemental Table 1).
In VIR samples, p24 displayed the typical network-like staining pattern, likely representing virions captured by follicular dendritic cells within B cell follicles (Figure 2A). While CD33+ cells were predominantly localized in the interfollicular T cell area, their presence within B cell follicles positively correlated with the mean fluorescence intensity (MFI) of p24 (Figure 2B). Conversely, in LNs from ART PWH, despite detecting both p24 and CD33 signals, CD33+ cells rarely penetrated the B cell follicle (Figure 2C), demonstrating considerably greater follicular infiltration of MDSCs during uncontrolled compared with treated infection (Figure 2D). IHC staining for CD33 and HLA-DR on LN sections from 1 VIR and 1 ART PWH (participants VIR#17 and ART#50; Supplemental Table 1) confirmed the absence of HLA-DR expression in the CD33+ cells, supporting their identity as MDSCs (Supplemental Figure 3).
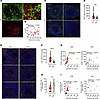 Figure 2
Localization of HIV-infected cells and MDSCs within lymph nodes of VIR and ART individuals. (A) Representative micrograph of a lymph node section from a VIR individual stained for CD33 (green) and p24 (red) (×40 magnification). White boxes indicate a region where infected cells (p24+) and MDSCs (CD33+) colocalize. The right panel shows a zoomed view of this region. (B) Correlation between p24 expression, represented as MFI, and CD33+ cell density per follicle in lymph node samples from VIR individuals (n = 3). (C) Representative lymph node sections from an ART individual stained for CD33 (green), p24 (red), and DAPI (blue) (×20 magnification). (D) Violin plot showing the density of MDSCs (CD33+ cells) within B cell follicles. (E) Representative lymph node sections from one VIR and one ART individuals stained for CD8 (red), GzmB (green), and DAPI (blue). (F) Violin plot displaying CD8+ cell infiltration within B cell follicles. (G) Correlations between CD8+ and CD33+ cells within B cell follicles. (H) Violin plot showing the percentage of GzmB expression within CD8+ cells in B follicles. (I) Correlations between GzmB expression within CD8+ cells and CD33+ cells in B cell follicles. Unless otherwise indicated, analyses include lymph node samples from VIR (n = 3) and ART (n = 1) PWH. Statistical comparisons in D, F, and H were performed using 2-sided Mann-Whitney U test. **P < 0.01, ***P < 0.001, and ****P < 0.0001. Median values with quartiles are represented in these graphs. Correlations were evaluated by Spearman analysis. Source data are provided as a Source Data file.
Subsequently, we examined whether MDSCs within the B cell follicles might foster an immunosuppressive environment that impairs effector T cell function by analyzing the follicular infiltration of CD8+ cells and their cytotoxic activity based on granzyme B (GzmB) expression (Figure 2E). For this analysis, we used LN samples from 3 VIR and 1 ART PWH (participants VIR#14–16 and ART#50; Supplemental Table 1). We observed that viremia promoted CD8+ cell infiltration into B cell follicles, which was reduced during ART (Figure 2, E and F). Additionally, the follicular presence of CD8+ cells strongly correlated with CD33+ cells in both VIR and ART (Figure 2G). Notably, GzmB expression in CD8+ cells within the B cell follicles was diminished in VIR compared with ART individuals (Figure 2H). Interestingly, GzmB and CD33+ staining positively correlated in VIR but not in ART samples (Figure 2I). Taken together, while viremia is likely the primary factor driving the follicular infiltration of MDSCs and CD8+ cells, the lower expression of GzmB in CD8+ during uncontrolled infection might be due to the increased presence of MDSCs within the B cell follicles.
MDSCs with enhanced immunosuppressive potential are increased in PWH and persist during ART. Next, we evaluated the immunosuppressive potential of MDSCs present in the peripheral blood of HD and PWH (participants HD#1–11, VIR#1–13, and ART#1–26; Supplemental Table 1) by assessing the expression of the immunomodulatory mediators: ARG1 and IDO. In general, ARG1 activity was elevated in G-MDSCs across all cohorts; however, ARG1 expression was significantly upregulated in G-MDSCs from both VIR and ART (medianVIR = 79% and medianART = 85.8%), compared with HD (medianHD = 63.3%) (Figure 3, A and B). Furthermore, we observed a higher proportion of G-MDSCs ARG1+ within total live cells in PWH (medianHD = 0.01%; medianVIR = 0.11% and medianART = 0.24%), though this was statistically significant only in the ART cohort (Figure 3B). In contrast, ARG1 levels remained low in M-MDSCs across all cohorts (medianHD = 0.08%, medianVIR = 0.08% and medianART = 0.21%), with only a nonsignificant trend toward upregulation in PWH (Figure 3C). Nonetheless, the frequency of M-MDSCs ARG1+ within total live cells was significantly higher in the ART cohort (medianART = 8.8 × 10⁻⁴%), but not the VIR cohort (medianVIR = 5.0 × 10⁻⁴%) compared with the HD group (medianHD = 2.6 × 10⁻⁴%) (Figure 3C).
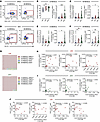 Figure 3
Elevated frequencies of MDSCs with enhanced immunosuppressive capacities in PWH. (A) Representative flow cytometry gating examples displaying ARG1 expression in the 2 MDSC subsets studied. (B) Violin plots depicting ARG1 expression in G-MDSCs and the proportion of G-MDSCs ARG1+ within total live PBMCs from HD, VIR, and ART individuals. (C) Violin plots displaying ARG1 expression in M-MDSCs and the proportion of M-MDSCs ARG1+ within total live PBMCs across cohorts. (D) Representative flow cytometry gating examples illustrating IDO expression in G-MDSCs and M-MDSCs. (E) Violin plots showing IDO expression in G-MDSCs and the proportion of G-MDSCs IDO+ within total live PBMCs from HD, VIR, and ART individuals. (F) Violin plots displaying IDO expression in M-MDSCs and the proportion of M-MDSCs IDO+ within total live PBMCs across cohorts. (G) Dot plots representing the proportion of ARG1+ and IDO+ subsets of G-MDSCs and M-MDSCs among total MDSCs expressing ARG1 and/or IDO in the VIR and ART groups. (H and I) Correlations between G-MDSCs ARG1+, M-MDSCs ARG1+, and G-MDSCs IDO+ in the VIR (H) and ART (I) cohorts. (J) Correlations between CD4+ T cells and the MDSC subsets expressing ARG1 or IDO in the VIR group. All panels include data from HD (n = 11), VIR (n = 13), and ART (n = 26) PWH. Statistical comparisons in B, C, E, and F were performed using 2-sided Kruskal-Wallis tests with Dunn’s post hoc correction. *P < 0.05, **P < 0.01, and ***P < 0.001. Median values with quartiles are represented in these graphs. Correlations were assessed using Spearman analysis. Source data are provided as a Source Data file.
Regarding IDO, expression levels were comparable between G-MDSCs and M-MDSCs. G-MDSCs from PWH did not express more IDO than those from HD (medianHD = 1.60%; medianVIR = 0.87% and medianART = 0.82%); nevertheless, a significant rise in G-MDSCs IDO+ within live cells was observed in the ART cohort, but not in the VIR group, compared with the HD group (medianHD = 5.5 × 10⁻⁴%, medianVIR = 1.1 × 10⁻³%, and medianART = 4.1 × 10⁻³%) (Figure 3, D and E). Conversely, M-MDSCs from both VIR and ART individuals exhibited significantly higher IDO expression than those from the HD cohort (medianHD = 0.10%, medianVIR = 1.97% and medianART = 1.16%) (Figure 3F). Furthermore, the percentage of M-MDSCs IDO+ was elevated in both VIR and ART groups when compared with the HD cohort (medianHD = 3.9 × 10⁻⁴%, medianVIR = 9.4 × 10⁻³%, and medianART = 5.7 × 10⁻³%) (Figure 3F).
Among the immunosuppressive MDSC subsets studied, G-MDSCs ARG1+ were the most prevalent subpopulation in both VIR and ART cohorts (medianVIR = 92.5% and medianART = 95%), followed by M-MDSCs IDO+ (medianVIR = 6% and medianART = 1.5%), while G-MDSCs IDO+ (medianVIR = 1% and medianART = 1%) and M-MDSCs ARG1+ (medianVIR = 0.5% and medianART = 0.5%) were present at much lower frequencies (Figure 3G). This distribution was similar in HD individuals (Supplemental Figure 4A). Moreover, the frequencies of G-MDSCs ARG1+, M-MDSCs ARG1+, and G-MDSCs IDO+ strongly and positively correlated with one another in both VIR and ART cohorts (Figure 3, H and I, and Supplemental Figure 4B). In contrast, M-MDSCs IDO+ did not correlate with any other subset (Supplemental Figure 4B). Additionally, a negative trend was observed between both G-MDSCs ARG1+ and M-MDSCs ARG1+ frequencies and the percentage of CD4+ T cells in the VIR group, whereas this trend was less pronounced for IDO-expressing subsets (Figure 3J).
Overall, we found distinct expression of ARG1 and IDO in G-MDSCs and M-MDSCs in response to HIV infection. Heightened expression of ARG1 was detected exclusively in G-MDSCs, while IDO was solely increased in M-MDSCs from PWH. Moreover, all these immunosuppressive subsets were more abundant in PWH on ART than in HD individuals.
Chronic immune activation under ART is associated with increased Treg levels but not with MDSC persistence. Chronic HIV infection induces the expansion of immunosuppressive cells, including FOXP3+CD25+CD4+ Tregs and MDSCs (44, 75–77). Despite the presence of these suppressor cells, immune activation markers (HLA-DR, CD38) on CD4+ and CD8+ T cells remain elevated even under effective ART (78, 79). To assess the association between MDSC subsets and this dysregulated immune environment, we used a flow cytometry panel including markers for T cells (CD3, CD4, CD8), Tregs (CD25, FOXP3), and T cell activation (HLA-DR, CD38) (Supplemental Figure 5). We analyzed samples from 19 PWH (VIR = 10 and ART = 9) and 10 HD individuals (participants HD#12–21, VIR#1, 4–10, 12, and 13, and ART#1, 2, 5–8, 17, 22, and 25; Supplemental Table 1) and identified Tregs and chronically activated CD4+ and CD8+ T cells based on the aforementioned markers (Supplemental Figure 5, A and B). Consistent with previous reports (75, 76, 78, 79), VIR PWH exhibited a significant increase in Treg frequencies (medianVIR = 5.90%; medianHD = 3.78%), alongside elevated HLA-DR and CD38 expression in both CD4+ T cells (medianHD = 0.25%, medianVIR = 1.85%) and CD8+ T cells (medianHD = 0.54%, medianVIR = 8.49%) compared with HD individuals (Figure 4, A–C). Treg frequencies and T cell activation levels remained higher in the ART cohort than in the HD group (medianART-Treg = 4.86%; medianART-Act CD4 = 0.68%; medianART-Act CD8 = 1.85%) (Figure 4, A–C). Additionally, we observed positive trends between Treg frequencies and chronic T cell activation, as well as between HLA-DR and CD38 coexpression in CD4+ T cells and in CD8+ T cells in both PWH cohorts (Supplemental Figure 6).
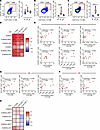 Figure 4
Expansion and persistence of highly immunosuppressive MDSCs in the dysregulated immune environment of chronic HIV infection. (A) Violin plots displaying the frequency of FOXP3+CD25+CD4+ T cells (Tregs) within total CD4+ T cells across HD, VIR, and ART cohorts. (B and C) Violin plots showing HLA-DR and CD38 expression in CD4+ T cells (B) and CD8+ T cells (C) from HD, VIR, and ART individuals. (D) Correlations between Tregs, as well as chronic activation in both CD4+ T cells and CD8+ T cells, and the G-MDSCs (C06) and M-MDSCs (C07) subsets in the VIR cohort. (E) Correlations between Tregs within total CD4+ T cells and all subsets of MDSCs in VIR individuals. (F) Correlations between G-MDSCs and G-MDSCs ARG1+, and activation in CD4+ T cells in the VIR group. (G) Correlations between G-MDSCs, G-MDSCs ARG1+ and M-MDSCs ARG1+, and activation in CD8+ T cells in the VIR cohort. (H) Correlations between Tregs, as well as chronic activation in both CD4+ T cells and CD8+ T cells, and the G-MDSCs (C06) and M-MDSCs (C07) subsets in the ART cohort. Statistical comparisons in A–C were performed using the 2-sided Kruskal-Wallis test with Dunn’s post hoc correction. *P < 0.05, **P < 0.01, and ****P < 0.0001. Median values with quartiles are depicted in the graphs. Unless otherwise indicated, analyses include samples from 10 HD, 10 VIR, and 9 ART individuals. Correlations were assessed using Spearman analysis. Source data are provided as a Source Data file.
We subsequently examined whether G-MDSCs and M-MDSCs and their respective ARG1+ or IDO+ subsets correlated with Treg frequencies and chronic immune activation in PWH (Figure 4D). In the VIR cohort, we observed strong positive trends between all MDSC subsets and Tregs (Figure 4, D and E). Likewise, positive correlations were detected between all MDSC subsets and chronic T cell activation (Figure 4D). Specifically, HLA-DR and CD38 expression in CD4+ T cells robustly and significantly correlated with total G-MDSCs (rG-MDSCs = 0.6848, PG-MDSCs = 0.0347) and G-MDSCs ARG1+ (rG-MDSCs ARG1+ = 0.6848, PG-MDSCs ARG1+ = 0.0347) (Figure 4F). Similarly, HLA-DR+ CD38+ CD8+ T cells were positively associated with total G-MDSCs (rG-MDSCs = 0.6364, PG-MDSCs = 0.0544), G-MDSCs ARG1+ (rG-MDSCs ARG1+ = 0.6364, PG-MDSCs ARG1+ = 0.0544) and M-MDSCs ARG1+ (rM-MDSCs ARG1+ = 0.6565, PM-MDSCs ARG1+ = 0.0448) (Figure 4, D and G). However, only the correlation with M-MDSCs ARG1+ reached statistical significance (Figure 4, D and G). These results suggest that chronic immune activation during uncontrolled HIV infection is accompanied by the expansion of Tregs and MDSCs with enhanced immunosuppressive capabilities.
In contrast, in the ART cohort, where T cell activation, Tregs, and MDSC frequencies remained elevated relative to the HD group (Figure 4, A–C, and Figure 1D), MDSCs displayed no robust positive correlations with either Tregs or HLA-DR and CD38 expression in CD4+ T and CD8+ T cells (Figure 4H). These findings suggest that, while the highly inflammatory environment of untreated viremia coordinates Treg and MDSC expansion, chronic low-level immune activation during ART does not drive MDSC persistence.
G-MDSCs are linked to HIV persistence during treatment. To further define the role of MDSCs in HIV pathogenesis, we examined associations between MDSC abundance and markers of viral burden, reservoir size, and clinical parameters in PWH (participants VIR#2–13 and ART#1–3, 5, 7, 8, 13, 17, and 19–26; Supplemental Table 1). Initially, we quantified intracellular HIV RNA and DNA across cohorts, revealing higher levels of both in VIR individuals, as expected (Supplemental Figure 7, A–C). HIV RNA and DNA levels were inversely associated with CD4+ T cell frequencies in both cohorts (Supplemental Figure 7D). We next assessed the HIV reservoir in ART PWH by quantifying intact HIV DNA (Supplemental Figure 7E). Given potential differences in MDSC-mediated immunosuppression between active viral replication and treated infection, VIR and ART individuals were analyzed separately.
In the VIR cohort, we found no statistically significant associations between MDSCs ARG1+ or IDO+ and HIV RNA, HIV DNA, or HIV RNA/DNA ratio (Figure 5A). However, there was a trend toward a positive correlation between total M-MDSCs and HIV DNA (rM-MDSCs = 0.5549, PM-MDSCs = 0.0525) (Figure 5B), suggesting an expansion of M-MDSCs during untreated infection that may contribute to viral reservoir establishment and persistence. Moreover, IDO expression in M-MDSCs positively correlated with the HIV RNA:DNA ratio (rIDO in M-MDSCs = 0.6713, PIDO in M-MDSCs = 0.0202) (Supplemental Figure 7F), linking upregulated IDO activity to increased HIV transcriptional activity.
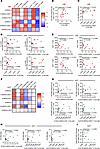 Figure 5
MDSCs expand during acute HIV infection and are maintained during ART associated with low-level viral transcription. Spearman correlation analysis displaying relationships in the VIR cohort between: (A) G-MDSCs and M-MDSCs, as well as their ARG1+ and IDO+ subsets; HIV RNA (n = 12) and HIV DNA (n = 13) within CD4+ T cells; the HIV RNA/DNA ratio (n = 12); Viral Load (VL) (n = 13); CD4+ T cell count (n = 13); VL zenith (n = 13); and nadir CD4+ T cell count (n = 13). (B) M-MDSCs and HIV DNA in CD4+ T cells (n = 13). (C) M-MDSCs ARG1+ and VL (n = 13). (D) All G-MDSC subsets and M-MDSCs ARG1+ and VL zenith (n = 13). (E) G-MDSCs, M-MDSCs and their ARG1+ subsets, and nadir CD4+ T cell count (n = 13). Spearman correlation analysis displaying relationships in the ART cohort between: (F) all MDSC subsets and HIV RNA (n = 16) and HIV DNA (n = 14) within CD4+ T cells, the HIV RNA/DNA ratio (n = 14), intact HIV DNA in CD4+ T cells (n = 13), CD4+ T cell count (n = 26), and months on suppressive ART (MAS) (n = 26). (G) G-MDSCs, G-MDSCs ARG1+, G-MDSCs IDO+ and M-MDSCs ARG1+, and HIV RNA within CD4+ T cells (n = 16). (H) G-MDSCs ARG1+, G-MDSCs IDO+, and M-MDSCs ARG1+ and the HIV RNA:DNA ratio (n = 14). (I) M-MDSCs ARG1+ and intact HIV DNA in CD4+ T cells (n = 13). Source data are provided as a Source Data file.
Subsequently, we evaluated correlations between MDSCs and key prognostic markers of HIV disease. M-MDSCs ARG1+ frequency and ARG1 expression levels within M-MDSCs were positively associated with plasma VL (rM-MDSCs ARG1+ = 0.5470, PM-MDSCs ARG1+ = 0.0567; rARG1+ in M-MDSCs = 0.5249, pARG1+ in M-MDSCs = 0.0690) (Figure 5C and Supplemental Figure 7F), implying that this specific immunoregulatory MDSC subset may exert a direct influence on the progression of HIV infection or arise as a consequence thereof. Notably, G-MDSCs and their ARG1+ or IDO+ subsets robustly and positively correlated with peak plasma VL or VL zenith (defined as the highest viral load value observed during follow-up) (rG-MDSCs = 0.6044, PG-MDSCs = 0.0320; rG-MDSCs-ARG1+ = 0.5997, PG-MDSCs-ARG1+ = 0.0331; rG-MDSCs-IDO+ = 0.5989, PG-MDSCs-IDO+ = 0.0340) (Figure 5, A and D). Trends toward positive associations were also observed between the frequency of M-MDSC ARG1+ and ARG1 expression in M-MDSCs and VL zenith (rM-MDSCs-ARG1+ = 0.5359, PM-MDSCs-ARG1+ = 0.0627; rARG1+ in M-MDSCs = 0.5259, PARG1+ in M-MDSCs = 0.0627) (Figure 5D and Supplemental Figure 7F). These associations were coupled with negative correlations with nadir CD4+ T cell counts for some subsets (rG-MDSCs = –0.5337,PpG-MDSCs = 0.0629; rG-MDSCs-ARG1+ = –0.5069, PG-MDSCs-ARG1+ = 0.0791; rM-MDSCs-ARG1+ = –0.6058, PM-MDSCs-ARG1+ = 0.0313) (Figure 5E). Interestingly, although M-MDSCs did not correlate with VL zenith, they showed a strong inverse association with nadir CD4+ T cells (rM-MDSCs = –0.7070, PM-MDSCs = 0.0087). These results hint at a marked expansion of specific immunosuppressive MDSC subsets during the replicative phase of the infection, linking active viral replication to the generation of these subpopulations.
Next, our focus shifted toward characterizing MDSCs in the context of treated infection. For this analysis, we used samples from ART individuals on suppressive drug regimens for a median duration of 49 months (Supplemental Table 1). All G-MDSC subsets and M-MDSCs ARG1+ positively correlated with HIV RNA levels within CD4+ T cells (rG-MDSCs = 0.5643, PG-MDSCs = 0.0310; rG-MDSCs-ARG1+ = 0.6130, PG-MDSCs-ARG1+ = 0.0171; rG-MDSCs-IDO+ = 0.5594, PG-MDSCs-IDO+ = 0.0324; rM-MDSCs-ARG1+ = 0.5576, PM-MDSCs-ARG1+ = 0.0330) (Figure 5, F and G), suggesting a link between MDSCs, particularly G-MDSCs, and HIV transcriptional activity within the CD4+ T cell compartment during ART. Similar trends were observed for the HIV RNA/DNA ratio (Figure 5, F and H), supporting an association between MDSCs and per-cell low-level transcription. Moreover, ARG1 expression in M-MDSCs positively correlated with both HIV RNA (rARG1+ in M-MDSCs = 0.5798, , PARG1+ in M-MDSCs = 0.0204) and the HIV RNA:DNA ratio (rARG1+ in M-MDSCs = 0.5501, , PARG1+ in M-MDSCs = 0.0442) (Supplemental Figure 7G), indicating that ARG1 activity in this subset may be driven by residual viral transcription. We next examined associations with total and intact HIV DNA. No significant correlations were observed between MDSC subsets and either measure, except for a near-significant inverse trend between M-MDSCs ARG1+ and intact HIV DNA (rM-MDSCs-ARG1+ = –0.5309, PM-MDSCs-ARG1+ = 0.0647) (Figure 5, F and I). These findings suggest that MDSC abundance under ART is driven by low-level viral transcription rather than overall reservoir size.
Furthermore, individuals with higher CD4+ T cell counts and longer durations on suppressive ART (Months ART-suppressed [MAS]) did not display reduced MDSC frequencies (Figure 5F). Notably, IDO expression in G-MDSCs showed an inverse association with CD4+ T cell frequency (rIDO in G-MDSCs = –0.4446, PIDO in G-MDSCs = 0.0539) and absolute counts (rIDO in G-MDSCs = –0.4752, PIDO in G-MDSCs = 0.0142) (Supplemental Figure 7G), suggesting that reduced IDO activity in this subset may accompany improved immune reconstitution. Overall, these findings indicate that MDSC levels remain elevated despite suppressive ART and may be sustained in part by residual viral transcriptional activity.
G-MDSCs from PWH inhibit HIV reactivation from the latent reservoir in a contact-independent manner. MDSCs may perpetuate HIV reservoirs by limiting viral reactivation. Given that G-MDSCs exhibited the strongest association with markers of viral persistence, we conducted functional ex vivo coculture assays using isolated G-MDSCs and autologous, pharmacologically reactivated CD4+ T cells from ART PWH (participants ART#10–12, 14, 16–18, 27, and 29–37; Supplemental Table 1). Following a previously validated method (14, 80), we evaluated CD4+ T cell activation via surface CD69 expression and viral reactivation by measuring intracellular HIV p24 levels, after PMA and Ionomycin stimulation (Supplemental Figure 8). G-MDSCs elicited a modest yet significant reduction (median decrease: 4.1%) in CD69 expression on CD4+ T cells (Figure 6A). Crucially, G-MDSCs significantly decreased intracellular p24 levels (median reduction: 79.1%), indicating that they could impede viral reactivation from the latent reservoir (Figure 6B). To further assess whether G-MDSCs contribute to reservoir maintenance, we quantified intact HIV DNA by IPDA in CD4+ T cells left unstimulated or following reactivation in the presence or absence of G-MDSCs (participants ART#19 and 45–49; Supplemental Table 1), observing no statistically significant differences in intact HIV DNA levels between conditions. Together, our data suggest that G-MDSCs limit viral inducibility, potentially contributing to reservoir persistence.
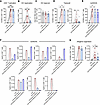 Figure 6
G-MDSCs decrease CD4+ T-cell activation and HIV reactivation. Ex vivo reactivated CD4+ T cells (CD4 React) from ART PWH were cocultured overnight with G-MDSCs, after which CD4+ T cell activation and viral reactivation were measured. Graphs showing: (A and B) CD69 expression (n = 13) (A) and intracellular p24 levels (n = 8) (B) within CD4+ T cells after coculture with autologous G-MDSCs. (C) Intact HIV DNA levels in CD4+ T cells unstimulated and following reactivation in the presence or absence of autologous G-MDSCs (n = 6). (D) Impact on CD4+ T cell activation (n = 6) and p24 levels within CD4+ T cells (n = 8) when CD4+ T cells and G-MDSCs were cultured in a transwell system. (E and F) Effect of the ARG1 inhibitor nor-NOHA on CD4+ T cell activation (n = 7) (E) and intracellular p24 expression (n = 7) (F) when added to the CD4+ T cell-MDSC coculture. (G) CD69 (n = 4) and p24 expression (n = 6) in reactivated CD4+ T cells from ART PWH cultured alone or in the presence of G-MDSCs from HD individuals. In all panels, each point represents an individual donor from independent assays and lines connect paired mono- and cocultures. Circles indicate experiments in which autologous CD4+ T cells and G-MDSCs were cultured in direct contact, diamonds indicate transwell cultures, and squares represent heterologous cultures using G-MDSCs from HD individuals. All experiments were independently replicated, with each run including PBMC samples from distinct donors. Statistical comparisons were performed using 2-sided Wilcoxon tests with significance levels denoted as *P < 0.05; **P < 0.01; ***P < 0.001; ****P < 0.0001. Mean values are represented in these graphs. Source data are provided as a Source Data file.
Next, to determine whether G-MDSC–mediated inhibition of viral reactivation was contact dependent, we conducted coculture experiments in transwells (participants ART#11, 16, 18, 28–31, and 36; Supplemental Table 1). G-MDSCs reduced both CD69 expression and intracellular p24 levels in the transwell setup (Figure 6D), demonstrating that their suppressive effect is contact independent. To elucidate the underlying mechanism, we investigated which soluble factor–mediated mechanism could be involved in this inhibition. Given the elevated ARG1 expression in G-MDSCs from ART individuals, we hypothesized that this enzymatic activity could contribute to this suppression. To test this possibility, G-MDSC–T cell coculture experiments were performed in the presence of the ARG1 inhibitor nor-NOHA (37, 81–83). Remarkably, while ARG1 inhibition had no significant effect on CD4+ T cell activation (Figure 6E), HIV reactivation was almost completely restored in most assays (Figure 6F), identifying ARG1 activity as a key mediator of G-MDSC–driven suppression of viral reactivation.
Furthermore, to assess whether the observed suppressive activity is specific to G-MDSCs from PWH, we performed allogeneic coculture assays pairing reactivated CD4+ T cells from ART PWH with G-MDSCs isolated from HD (participants HD#22–27 and ART#38–44; Supplemental Table 1). HD-derived G-MDSCs also exhibited a trend toward reducing both CD4+ T cell activation and HIV reactivation (Figure 6G). These findings are consistent with our previous observations implicating ARG1 activity in viral reactivation suppression, as G-MDSCs from HD express baseline high levels of ARG1 (Figure 3B). Collectively, these results suggest that the suppression of HIV reactivation is driven by an intrinsic enzymatic property of G-MDSCs rather than an HIV-specific mechanism.
Overall, our results indicate that G-MDSCs can reduce CD4+ T cell activation and inhibit HIV reactivation in a contact-independent manner, with G-MDSC–derived ARG1 activity serving as a pivotal mediator of this suppression.


