
Research ArticleAgingEndocrinologyMetabolism
Open Access |  10.1172/jci.insight.197310
p21-senescent cells drive pancreatic islet dysfunction through targetable paracrine signaling in type 2 diabetes
Kanako Iwasaki,1 Priscila Carapeto,1 Cristian Abarca,1 Francesko Hela,1 Stephanie Sanjines,1 Sebastian Pena,1 Sandra Le,1 Hui Pan,1 Maya Jackson,1 Christopher Cahill,1 Ayush Midha,1 Juliana Alcoforado Diniz,2 Dylan Baker,2 Sergii Domanskyi,2 Sara Espinoza,3 Alejandro Peña,4 Francisco G. Cigarroa,4 Jillian L. Woodworth,4 Jeffrey H. Chuang,2,5 Vesna D. Garovic,6 James L. Kirkland,7 Tamara Tchkonia,7 Nicolas Musi,3 George A. Kuchel,8 Paul Robson,2 and Cristina Aguayo-Mazzucato1
1Joslin Diabetes Center/Harvard Medical School, Boston, Massachusetts, USA.
2The Jackson Laboratory for Genomic Medicine, Farmington, Connecticut, USA.
3Center for Translational Geroscience, Department of Medicine, Cedars-Sinai Medical Center, Los Angeles, California, USA.
4UT Health San Antonio Transplant Center, San Antonio, Texas, USA.
5Department of Genetics and Genome Sciences, UConn Health, Farmington, Connecticut, USA.
6Division of Nephrology and Hypertension, Department of Medicine, Mayo Clinic, Rochester, Minnesota, USA.
7Center for Advanced Gerotherapeutics, Department of Medicine, Cedars-Sinai Medical Center, Los Angels, California, USA.
8UConn Center on Aging, UConn Health, Farmington, Connecticut, USA.
Address correspondence to: Cristina Aguayo-Mazzucato, Joslin Diabetes Center, Center for Life Sciences 5th Floor, 3 Blackfan Street, Boston, Massachusetts, 02215, USA. Email: cristina.aguayo-mazzucato@joslin.harvard.edu.
Authorship note: KI and PC contributed equally to this work.
Find articles by Iwasaki, K. in: PubMed | Google Scholar
1Joslin Diabetes Center/Harvard Medical School, Boston, Massachusetts, USA.
2The Jackson Laboratory for Genomic Medicine, Farmington, Connecticut, USA.
3Center for Translational Geroscience, Department of Medicine, Cedars-Sinai Medical Center, Los Angeles, California, USA.
4UT Health San Antonio Transplant Center, San Antonio, Texas, USA.
5Department of Genetics and Genome Sciences, UConn Health, Farmington, Connecticut, USA.
6Division of Nephrology and Hypertension, Department of Medicine, Mayo Clinic, Rochester, Minnesota, USA.
7Center for Advanced Gerotherapeutics, Department of Medicine, Cedars-Sinai Medical Center, Los Angels, California, USA.
8UConn Center on Aging, UConn Health, Farmington, Connecticut, USA.
Address correspondence to: Cristina Aguayo-Mazzucato, Joslin Diabetes Center, Center for Life Sciences 5th Floor, 3 Blackfan Street, Boston, Massachusetts, 02215, USA. Email: cristina.aguayo-mazzucato@joslin.harvard.edu.
Authorship note: KI and PC contributed equally to this work.
Find articles by Carapeto, P. in: PubMed | Google Scholar
1Joslin Diabetes Center/Harvard Medical School, Boston, Massachusetts, USA.
2The Jackson Laboratory for Genomic Medicine, Farmington, Connecticut, USA.
3Center for Translational Geroscience, Department of Medicine, Cedars-Sinai Medical Center, Los Angeles, California, USA.
4UT Health San Antonio Transplant Center, San Antonio, Texas, USA.
5Department of Genetics and Genome Sciences, UConn Health, Farmington, Connecticut, USA.
6Division of Nephrology and Hypertension, Department of Medicine, Mayo Clinic, Rochester, Minnesota, USA.
7Center for Advanced Gerotherapeutics, Department of Medicine, Cedars-Sinai Medical Center, Los Angels, California, USA.
8UConn Center on Aging, UConn Health, Farmington, Connecticut, USA.
Address correspondence to: Cristina Aguayo-Mazzucato, Joslin Diabetes Center, Center for Life Sciences 5th Floor, 3 Blackfan Street, Boston, Massachusetts, 02215, USA. Email: cristina.aguayo-mazzucato@joslin.harvard.edu.
Authorship note: KI and PC contributed equally to this work.
Find articles by Abarca, C. in: PubMed | Google Scholar
1Joslin Diabetes Center/Harvard Medical School, Boston, Massachusetts, USA.
2The Jackson Laboratory for Genomic Medicine, Farmington, Connecticut, USA.
3Center for Translational Geroscience, Department of Medicine, Cedars-Sinai Medical Center, Los Angeles, California, USA.
4UT Health San Antonio Transplant Center, San Antonio, Texas, USA.
5Department of Genetics and Genome Sciences, UConn Health, Farmington, Connecticut, USA.
6Division of Nephrology and Hypertension, Department of Medicine, Mayo Clinic, Rochester, Minnesota, USA.
7Center for Advanced Gerotherapeutics, Department of Medicine, Cedars-Sinai Medical Center, Los Angels, California, USA.
8UConn Center on Aging, UConn Health, Farmington, Connecticut, USA.
Address correspondence to: Cristina Aguayo-Mazzucato, Joslin Diabetes Center, Center for Life Sciences 5th Floor, 3 Blackfan Street, Boston, Massachusetts, 02215, USA. Email: cristina.aguayo-mazzucato@joslin.harvard.edu.
Authorship note: KI and PC contributed equally to this work.
Find articles by Hela, F. in: PubMed | Google Scholar
1Joslin Diabetes Center/Harvard Medical School, Boston, Massachusetts, USA.
2The Jackson Laboratory for Genomic Medicine, Farmington, Connecticut, USA.
3Center for Translational Geroscience, Department of Medicine, Cedars-Sinai Medical Center, Los Angeles, California, USA.
4UT Health San Antonio Transplant Center, San Antonio, Texas, USA.
5Department of Genetics and Genome Sciences, UConn Health, Farmington, Connecticut, USA.
6Division of Nephrology and Hypertension, Department of Medicine, Mayo Clinic, Rochester, Minnesota, USA.
7Center for Advanced Gerotherapeutics, Department of Medicine, Cedars-Sinai Medical Center, Los Angels, California, USA.
8UConn Center on Aging, UConn Health, Farmington, Connecticut, USA.
Address correspondence to: Cristina Aguayo-Mazzucato, Joslin Diabetes Center, Center for Life Sciences 5th Floor, 3 Blackfan Street, Boston, Massachusetts, 02215, USA. Email: cristina.aguayo-mazzucato@joslin.harvard.edu.
Authorship note: KI and PC contributed equally to this work.
Find articles by Sanjines, S. in: PubMed | Google Scholar
1Joslin Diabetes Center/Harvard Medical School, Boston, Massachusetts, USA.
2The Jackson Laboratory for Genomic Medicine, Farmington, Connecticut, USA.
3Center for Translational Geroscience, Department of Medicine, Cedars-Sinai Medical Center, Los Angeles, California, USA.
4UT Health San Antonio Transplant Center, San Antonio, Texas, USA.
5Department of Genetics and Genome Sciences, UConn Health, Farmington, Connecticut, USA.
6Division of Nephrology and Hypertension, Department of Medicine, Mayo Clinic, Rochester, Minnesota, USA.
7Center for Advanced Gerotherapeutics, Department of Medicine, Cedars-Sinai Medical Center, Los Angels, California, USA.
8UConn Center on Aging, UConn Health, Farmington, Connecticut, USA.
Address correspondence to: Cristina Aguayo-Mazzucato, Joslin Diabetes Center, Center for Life Sciences 5th Floor, 3 Blackfan Street, Boston, Massachusetts, 02215, USA. Email: cristina.aguayo-mazzucato@joslin.harvard.edu.
Authorship note: KI and PC contributed equally to this work.
Find articles by Pena, S. in: PubMed | Google Scholar
1Joslin Diabetes Center/Harvard Medical School, Boston, Massachusetts, USA.
2The Jackson Laboratory for Genomic Medicine, Farmington, Connecticut, USA.
3Center for Translational Geroscience, Department of Medicine, Cedars-Sinai Medical Center, Los Angeles, California, USA.
4UT Health San Antonio Transplant Center, San Antonio, Texas, USA.
5Department of Genetics and Genome Sciences, UConn Health, Farmington, Connecticut, USA.
6Division of Nephrology and Hypertension, Department of Medicine, Mayo Clinic, Rochester, Minnesota, USA.
7Center for Advanced Gerotherapeutics, Department of Medicine, Cedars-Sinai Medical Center, Los Angels, California, USA.
8UConn Center on Aging, UConn Health, Farmington, Connecticut, USA.
Address correspondence to: Cristina Aguayo-Mazzucato, Joslin Diabetes Center, Center for Life Sciences 5th Floor, 3 Blackfan Street, Boston, Massachusetts, 02215, USA. Email: cristina.aguayo-mazzucato@joslin.harvard.edu.
Authorship note: KI and PC contributed equally to this work.
Find articles by Le, S. in: PubMed | Google Scholar
1Joslin Diabetes Center/Harvard Medical School, Boston, Massachusetts, USA.
2The Jackson Laboratory for Genomic Medicine, Farmington, Connecticut, USA.
3Center for Translational Geroscience, Department of Medicine, Cedars-Sinai Medical Center, Los Angeles, California, USA.
4UT Health San Antonio Transplant Center, San Antonio, Texas, USA.
5Department of Genetics and Genome Sciences, UConn Health, Farmington, Connecticut, USA.
6Division of Nephrology and Hypertension, Department of Medicine, Mayo Clinic, Rochester, Minnesota, USA.
7Center for Advanced Gerotherapeutics, Department of Medicine, Cedars-Sinai Medical Center, Los Angels, California, USA.
8UConn Center on Aging, UConn Health, Farmington, Connecticut, USA.
Address correspondence to: Cristina Aguayo-Mazzucato, Joslin Diabetes Center, Center for Life Sciences 5th Floor, 3 Blackfan Street, Boston, Massachusetts, 02215, USA. Email: cristina.aguayo-mazzucato@joslin.harvard.edu.
Authorship note: KI and PC contributed equally to this work.
Find articles by
Pan, H.
in:
PubMed
|
Google Scholar
|

1Joslin Diabetes Center/Harvard Medical School, Boston, Massachusetts, USA.
2The Jackson Laboratory for Genomic Medicine, Farmington, Connecticut, USA.
3Center for Translational Geroscience, Department of Medicine, Cedars-Sinai Medical Center, Los Angeles, California, USA.
4UT Health San Antonio Transplant Center, San Antonio, Texas, USA.
5Department of Genetics and Genome Sciences, UConn Health, Farmington, Connecticut, USA.
6Division of Nephrology and Hypertension, Department of Medicine, Mayo Clinic, Rochester, Minnesota, USA.
7Center for Advanced Gerotherapeutics, Department of Medicine, Cedars-Sinai Medical Center, Los Angels, California, USA.
8UConn Center on Aging, UConn Health, Farmington, Connecticut, USA.
Address correspondence to: Cristina Aguayo-Mazzucato, Joslin Diabetes Center, Center for Life Sciences 5th Floor, 3 Blackfan Street, Boston, Massachusetts, 02215, USA. Email: cristina.aguayo-mazzucato@joslin.harvard.edu.
Authorship note: KI and PC contributed equally to this work.
Find articles by Jackson, M. in: PubMed | Google Scholar
1Joslin Diabetes Center/Harvard Medical School, Boston, Massachusetts, USA.
2The Jackson Laboratory for Genomic Medicine, Farmington, Connecticut, USA.
3Center for Translational Geroscience, Department of Medicine, Cedars-Sinai Medical Center, Los Angeles, California, USA.
4UT Health San Antonio Transplant Center, San Antonio, Texas, USA.
5Department of Genetics and Genome Sciences, UConn Health, Farmington, Connecticut, USA.
6Division of Nephrology and Hypertension, Department of Medicine, Mayo Clinic, Rochester, Minnesota, USA.
7Center for Advanced Gerotherapeutics, Department of Medicine, Cedars-Sinai Medical Center, Los Angels, California, USA.
8UConn Center on Aging, UConn Health, Farmington, Connecticut, USA.
Address correspondence to: Cristina Aguayo-Mazzucato, Joslin Diabetes Center, Center for Life Sciences 5th Floor, 3 Blackfan Street, Boston, Massachusetts, 02215, USA. Email: cristina.aguayo-mazzucato@joslin.harvard.edu.
Authorship note: KI and PC contributed equally to this work.
Find articles by Cahill, C. in: PubMed | Google Scholar
1Joslin Diabetes Center/Harvard Medical School, Boston, Massachusetts, USA.
2The Jackson Laboratory for Genomic Medicine, Farmington, Connecticut, USA.
3Center for Translational Geroscience, Department of Medicine, Cedars-Sinai Medical Center, Los Angeles, California, USA.
4UT Health San Antonio Transplant Center, San Antonio, Texas, USA.
5Department of Genetics and Genome Sciences, UConn Health, Farmington, Connecticut, USA.
6Division of Nephrology and Hypertension, Department of Medicine, Mayo Clinic, Rochester, Minnesota, USA.
7Center for Advanced Gerotherapeutics, Department of Medicine, Cedars-Sinai Medical Center, Los Angels, California, USA.
8UConn Center on Aging, UConn Health, Farmington, Connecticut, USA.
Address correspondence to: Cristina Aguayo-Mazzucato, Joslin Diabetes Center, Center for Life Sciences 5th Floor, 3 Blackfan Street, Boston, Massachusetts, 02215, USA. Email: cristina.aguayo-mazzucato@joslin.harvard.edu.
Authorship note: KI and PC contributed equally to this work.
Find articles by Midha, A. in: PubMed | Google Scholar
1Joslin Diabetes Center/Harvard Medical School, Boston, Massachusetts, USA.
2The Jackson Laboratory for Genomic Medicine, Farmington, Connecticut, USA.
3Center for Translational Geroscience, Department of Medicine, Cedars-Sinai Medical Center, Los Angeles, California, USA.
4UT Health San Antonio Transplant Center, San Antonio, Texas, USA.
5Department of Genetics and Genome Sciences, UConn Health, Farmington, Connecticut, USA.
6Division of Nephrology and Hypertension, Department of Medicine, Mayo Clinic, Rochester, Minnesota, USA.
7Center for Advanced Gerotherapeutics, Department of Medicine, Cedars-Sinai Medical Center, Los Angels, California, USA.
8UConn Center on Aging, UConn Health, Farmington, Connecticut, USA.
Address correspondence to: Cristina Aguayo-Mazzucato, Joslin Diabetes Center, Center for Life Sciences 5th Floor, 3 Blackfan Street, Boston, Massachusetts, 02215, USA. Email: cristina.aguayo-mazzucato@joslin.harvard.edu.
Authorship note: KI and PC contributed equally to this work.
Find articles by Diniz, J. in: PubMed | Google Scholar
1Joslin Diabetes Center/Harvard Medical School, Boston, Massachusetts, USA.
2The Jackson Laboratory for Genomic Medicine, Farmington, Connecticut, USA.
3Center for Translational Geroscience, Department of Medicine, Cedars-Sinai Medical Center, Los Angeles, California, USA.
4UT Health San Antonio Transplant Center, San Antonio, Texas, USA.
5Department of Genetics and Genome Sciences, UConn Health, Farmington, Connecticut, USA.
6Division of Nephrology and Hypertension, Department of Medicine, Mayo Clinic, Rochester, Minnesota, USA.
7Center for Advanced Gerotherapeutics, Department of Medicine, Cedars-Sinai Medical Center, Los Angels, California, USA.
8UConn Center on Aging, UConn Health, Farmington, Connecticut, USA.
Address correspondence to: Cristina Aguayo-Mazzucato, Joslin Diabetes Center, Center for Life Sciences 5th Floor, 3 Blackfan Street, Boston, Massachusetts, 02215, USA. Email: cristina.aguayo-mazzucato@joslin.harvard.edu.
Authorship note: KI and PC contributed equally to this work.
Find articles by Baker, D. in: PubMed | Google Scholar
1Joslin Diabetes Center/Harvard Medical School, Boston, Massachusetts, USA.
2The Jackson Laboratory for Genomic Medicine, Farmington, Connecticut, USA.
3Center for Translational Geroscience, Department of Medicine, Cedars-Sinai Medical Center, Los Angeles, California, USA.
4UT Health San Antonio Transplant Center, San Antonio, Texas, USA.
5Department of Genetics and Genome Sciences, UConn Health, Farmington, Connecticut, USA.
6Division of Nephrology and Hypertension, Department of Medicine, Mayo Clinic, Rochester, Minnesota, USA.
7Center for Advanced Gerotherapeutics, Department of Medicine, Cedars-Sinai Medical Center, Los Angels, California, USA.
8UConn Center on Aging, UConn Health, Farmington, Connecticut, USA.
Address correspondence to: Cristina Aguayo-Mazzucato, Joslin Diabetes Center, Center for Life Sciences 5th Floor, 3 Blackfan Street, Boston, Massachusetts, 02215, USA. Email: cristina.aguayo-mazzucato@joslin.harvard.edu.
Authorship note: KI and PC contributed equally to this work.
Find articles by Domanskyi, S. in: PubMed | Google Scholar
1Joslin Diabetes Center/Harvard Medical School, Boston, Massachusetts, USA.
2The Jackson Laboratory for Genomic Medicine, Farmington, Connecticut, USA.
3Center for Translational Geroscience, Department of Medicine, Cedars-Sinai Medical Center, Los Angeles, California, USA.
4UT Health San Antonio Transplant Center, San Antonio, Texas, USA.
5Department of Genetics and Genome Sciences, UConn Health, Farmington, Connecticut, USA.
6Division of Nephrology and Hypertension, Department of Medicine, Mayo Clinic, Rochester, Minnesota, USA.
7Center for Advanced Gerotherapeutics, Department of Medicine, Cedars-Sinai Medical Center, Los Angels, California, USA.
8UConn Center on Aging, UConn Health, Farmington, Connecticut, USA.
Address correspondence to: Cristina Aguayo-Mazzucato, Joslin Diabetes Center, Center for Life Sciences 5th Floor, 3 Blackfan Street, Boston, Massachusetts, 02215, USA. Email: cristina.aguayo-mazzucato@joslin.harvard.edu.
Authorship note: KI and PC contributed equally to this work.
Find articles by Espinoza, S. in: PubMed | Google Scholar
1Joslin Diabetes Center/Harvard Medical School, Boston, Massachusetts, USA.
2The Jackson Laboratory for Genomic Medicine, Farmington, Connecticut, USA.
3Center for Translational Geroscience, Department of Medicine, Cedars-Sinai Medical Center, Los Angeles, California, USA.
4UT Health San Antonio Transplant Center, San Antonio, Texas, USA.
5Department of Genetics and Genome Sciences, UConn Health, Farmington, Connecticut, USA.
6Division of Nephrology and Hypertension, Department of Medicine, Mayo Clinic, Rochester, Minnesota, USA.
7Center for Advanced Gerotherapeutics, Department of Medicine, Cedars-Sinai Medical Center, Los Angels, California, USA.
8UConn Center on Aging, UConn Health, Farmington, Connecticut, USA.
Address correspondence to: Cristina Aguayo-Mazzucato, Joslin Diabetes Center, Center for Life Sciences 5th Floor, 3 Blackfan Street, Boston, Massachusetts, 02215, USA. Email: cristina.aguayo-mazzucato@joslin.harvard.edu.
Authorship note: KI and PC contributed equally to this work.
Find articles by Peña, A. in: PubMed | Google Scholar
1Joslin Diabetes Center/Harvard Medical School, Boston, Massachusetts, USA.
2The Jackson Laboratory for Genomic Medicine, Farmington, Connecticut, USA.
3Center for Translational Geroscience, Department of Medicine, Cedars-Sinai Medical Center, Los Angeles, California, USA.
4UT Health San Antonio Transplant Center, San Antonio, Texas, USA.
5Department of Genetics and Genome Sciences, UConn Health, Farmington, Connecticut, USA.
6Division of Nephrology and Hypertension, Department of Medicine, Mayo Clinic, Rochester, Minnesota, USA.
7Center for Advanced Gerotherapeutics, Department of Medicine, Cedars-Sinai Medical Center, Los Angels, California, USA.
8UConn Center on Aging, UConn Health, Farmington, Connecticut, USA.
Address correspondence to: Cristina Aguayo-Mazzucato, Joslin Diabetes Center, Center for Life Sciences 5th Floor, 3 Blackfan Street, Boston, Massachusetts, 02215, USA. Email: cristina.aguayo-mazzucato@joslin.harvard.edu.
Authorship note: KI and PC contributed equally to this work.
Find articles by Cigarroa, F. in: PubMed | Google Scholar
1Joslin Diabetes Center/Harvard Medical School, Boston, Massachusetts, USA.
2The Jackson Laboratory for Genomic Medicine, Farmington, Connecticut, USA.
3Center for Translational Geroscience, Department of Medicine, Cedars-Sinai Medical Center, Los Angeles, California, USA.
4UT Health San Antonio Transplant Center, San Antonio, Texas, USA.
5Department of Genetics and Genome Sciences, UConn Health, Farmington, Connecticut, USA.
6Division of Nephrology and Hypertension, Department of Medicine, Mayo Clinic, Rochester, Minnesota, USA.
7Center for Advanced Gerotherapeutics, Department of Medicine, Cedars-Sinai Medical Center, Los Angels, California, USA.
8UConn Center on Aging, UConn Health, Farmington, Connecticut, USA.
Address correspondence to: Cristina Aguayo-Mazzucato, Joslin Diabetes Center, Center for Life Sciences 5th Floor, 3 Blackfan Street, Boston, Massachusetts, 02215, USA. Email: cristina.aguayo-mazzucato@joslin.harvard.edu.
Authorship note: KI and PC contributed equally to this work.
Find articles by Woodworth, J. in: PubMed | Google Scholar
1Joslin Diabetes Center/Harvard Medical School, Boston, Massachusetts, USA.
2The Jackson Laboratory for Genomic Medicine, Farmington, Connecticut, USA.
3Center for Translational Geroscience, Department of Medicine, Cedars-Sinai Medical Center, Los Angeles, California, USA.
4UT Health San Antonio Transplant Center, San Antonio, Texas, USA.
5Department of Genetics and Genome Sciences, UConn Health, Farmington, Connecticut, USA.
6Division of Nephrology and Hypertension, Department of Medicine, Mayo Clinic, Rochester, Minnesota, USA.
7Center for Advanced Gerotherapeutics, Department of Medicine, Cedars-Sinai Medical Center, Los Angels, California, USA.
8UConn Center on Aging, UConn Health, Farmington, Connecticut, USA.
Address correspondence to: Cristina Aguayo-Mazzucato, Joslin Diabetes Center, Center for Life Sciences 5th Floor, 3 Blackfan Street, Boston, Massachusetts, 02215, USA. Email: cristina.aguayo-mazzucato@joslin.harvard.edu.
Authorship note: KI and PC contributed equally to this work.
Find articles by Chuang, J. in: PubMed | Google Scholar
1Joslin Diabetes Center/Harvard Medical School, Boston, Massachusetts, USA.
2The Jackson Laboratory for Genomic Medicine, Farmington, Connecticut, USA.
3Center for Translational Geroscience, Department of Medicine, Cedars-Sinai Medical Center, Los Angeles, California, USA.
4UT Health San Antonio Transplant Center, San Antonio, Texas, USA.
5Department of Genetics and Genome Sciences, UConn Health, Farmington, Connecticut, USA.
6Division of Nephrology and Hypertension, Department of Medicine, Mayo Clinic, Rochester, Minnesota, USA.
7Center for Advanced Gerotherapeutics, Department of Medicine, Cedars-Sinai Medical Center, Los Angels, California, USA.
8UConn Center on Aging, UConn Health, Farmington, Connecticut, USA.
Address correspondence to: Cristina Aguayo-Mazzucato, Joslin Diabetes Center, Center for Life Sciences 5th Floor, 3 Blackfan Street, Boston, Massachusetts, 02215, USA. Email: cristina.aguayo-mazzucato@joslin.harvard.edu.
Authorship note: KI and PC contributed equally to this work.
Find articles by
Garovic, V.
in:
PubMed
|
Google Scholar
|
1Joslin Diabetes Center/Harvard Medical School, Boston, Massachusetts, USA.
2The Jackson Laboratory for Genomic Medicine, Farmington, Connecticut, USA.
3Center for Translational Geroscience, Department of Medicine, Cedars-Sinai Medical Center, Los Angeles, California, USA.
4UT Health San Antonio Transplant Center, San Antonio, Texas, USA.
5Department of Genetics and Genome Sciences, UConn Health, Farmington, Connecticut, USA.
6Division of Nephrology and Hypertension, Department of Medicine, Mayo Clinic, Rochester, Minnesota, USA.
7Center for Advanced Gerotherapeutics, Department of Medicine, Cedars-Sinai Medical Center, Los Angels, California, USA.
8UConn Center on Aging, UConn Health, Farmington, Connecticut, USA.
Address correspondence to: Cristina Aguayo-Mazzucato, Joslin Diabetes Center, Center for Life Sciences 5th Floor, 3 Blackfan Street, Boston, Massachusetts, 02215, USA. Email: cristina.aguayo-mazzucato@joslin.harvard.edu.
Authorship note: KI and PC contributed equally to this work.
Find articles by Kirkland, J. in: PubMed | Google Scholar
1Joslin Diabetes Center/Harvard Medical School, Boston, Massachusetts, USA.
2The Jackson Laboratory for Genomic Medicine, Farmington, Connecticut, USA.
3Center for Translational Geroscience, Department of Medicine, Cedars-Sinai Medical Center, Los Angeles, California, USA.
4UT Health San Antonio Transplant Center, San Antonio, Texas, USA.
5Department of Genetics and Genome Sciences, UConn Health, Farmington, Connecticut, USA.
6Division of Nephrology and Hypertension, Department of Medicine, Mayo Clinic, Rochester, Minnesota, USA.
7Center for Advanced Gerotherapeutics, Department of Medicine, Cedars-Sinai Medical Center, Los Angels, California, USA.
8UConn Center on Aging, UConn Health, Farmington, Connecticut, USA.
Address correspondence to: Cristina Aguayo-Mazzucato, Joslin Diabetes Center, Center for Life Sciences 5th Floor, 3 Blackfan Street, Boston, Massachusetts, 02215, USA. Email: cristina.aguayo-mazzucato@joslin.harvard.edu.
Authorship note: KI and PC contributed equally to this work.
Find articles by Tchkonia, T. in: PubMed | Google Scholar
1Joslin Diabetes Center/Harvard Medical School, Boston, Massachusetts, USA.
2The Jackson Laboratory for Genomic Medicine, Farmington, Connecticut, USA.
3Center for Translational Geroscience, Department of Medicine, Cedars-Sinai Medical Center, Los Angeles, California, USA.
4UT Health San Antonio Transplant Center, San Antonio, Texas, USA.
5Department of Genetics and Genome Sciences, UConn Health, Farmington, Connecticut, USA.
6Division of Nephrology and Hypertension, Department of Medicine, Mayo Clinic, Rochester, Minnesota, USA.
7Center for Advanced Gerotherapeutics, Department of Medicine, Cedars-Sinai Medical Center, Los Angels, California, USA.
8UConn Center on Aging, UConn Health, Farmington, Connecticut, USA.
Address correspondence to: Cristina Aguayo-Mazzucato, Joslin Diabetes Center, Center for Life Sciences 5th Floor, 3 Blackfan Street, Boston, Massachusetts, 02215, USA. Email: cristina.aguayo-mazzucato@joslin.harvard.edu.
Authorship note: KI and PC contributed equally to this work.
Find articles by Musi, N. in: PubMed | Google Scholar
1Joslin Diabetes Center/Harvard Medical School, Boston, Massachusetts, USA.
2The Jackson Laboratory for Genomic Medicine, Farmington, Connecticut, USA.
3Center for Translational Geroscience, Department of Medicine, Cedars-Sinai Medical Center, Los Angeles, California, USA.
4UT Health San Antonio Transplant Center, San Antonio, Texas, USA.
5Department of Genetics and Genome Sciences, UConn Health, Farmington, Connecticut, USA.
6Division of Nephrology and Hypertension, Department of Medicine, Mayo Clinic, Rochester, Minnesota, USA.
7Center for Advanced Gerotherapeutics, Department of Medicine, Cedars-Sinai Medical Center, Los Angels, California, USA.
8UConn Center on Aging, UConn Health, Farmington, Connecticut, USA.
Address correspondence to: Cristina Aguayo-Mazzucato, Joslin Diabetes Center, Center for Life Sciences 5th Floor, 3 Blackfan Street, Boston, Massachusetts, 02215, USA. Email: cristina.aguayo-mazzucato@joslin.harvard.edu.
Authorship note: KI and PC contributed equally to this work.
Find articles by Kuchel, G. in: PubMed | Google Scholar
1Joslin Diabetes Center/Harvard Medical School, Boston, Massachusetts, USA.
2The Jackson Laboratory for Genomic Medicine, Farmington, Connecticut, USA.
3Center for Translational Geroscience, Department of Medicine, Cedars-Sinai Medical Center, Los Angeles, California, USA.
4UT Health San Antonio Transplant Center, San Antonio, Texas, USA.
5Department of Genetics and Genome Sciences, UConn Health, Farmington, Connecticut, USA.
6Division of Nephrology and Hypertension, Department of Medicine, Mayo Clinic, Rochester, Minnesota, USA.
7Center for Advanced Gerotherapeutics, Department of Medicine, Cedars-Sinai Medical Center, Los Angels, California, USA.
8UConn Center on Aging, UConn Health, Farmington, Connecticut, USA.
Address correspondence to: Cristina Aguayo-Mazzucato, Joslin Diabetes Center, Center for Life Sciences 5th Floor, 3 Blackfan Street, Boston, Massachusetts, 02215, USA. Email: cristina.aguayo-mazzucato@joslin.harvard.edu.
Authorship note: KI and PC contributed equally to this work.
Find articles by Robson, P. in: PubMed | Google Scholar
1Joslin Diabetes Center/Harvard Medical School, Boston, Massachusetts, USA.
2The Jackson Laboratory for Genomic Medicine, Farmington, Connecticut, USA.
3Center for Translational Geroscience, Department of Medicine, Cedars-Sinai Medical Center, Los Angeles, California, USA.
4UT Health San Antonio Transplant Center, San Antonio, Texas, USA.
5Department of Genetics and Genome Sciences, UConn Health, Farmington, Connecticut, USA.
6Division of Nephrology and Hypertension, Department of Medicine, Mayo Clinic, Rochester, Minnesota, USA.
7Center for Advanced Gerotherapeutics, Department of Medicine, Cedars-Sinai Medical Center, Los Angels, California, USA.
8UConn Center on Aging, UConn Health, Farmington, Connecticut, USA.
Address correspondence to: Cristina Aguayo-Mazzucato, Joslin Diabetes Center, Center for Life Sciences 5th Floor, 3 Blackfan Street, Boston, Massachusetts, 02215, USA. Email: cristina.aguayo-mazzucato@joslin.harvard.edu.
Authorship note: KI and PC contributed equally to this work.
Find articles by Aguayo-Mazzucato, C. in: PubMed | Google Scholar
Published June 9, 2026 - More info
JCI Insight. 2026;11(14):e197310. https://doi.org/10.1172/jci.insight.197310.
© 2026 Iwasaki et al. This work is licensed under the Creative Commons Attribution 4.0 International License. To view a copy of this license, visit http://creativecommons.org/licenses/by/4.0/.
Received: June 27, 2025; Accepted: May 22, 2026

-
Results
p21+ senescent β cells in mice are dysfunctional and lose transcriptional identity. We used previously published scRNA-Seq data (4) to analyze gene expression in pancreatic islets from 6- to 9-month-old male mice after acute induction of insulin resistance with the insulin receptor antagonist S961, with and without a 2-week recovery period (Figure 1A), completely reversing hyperglycemia and hyperinsulinemia (Supplemental Figure 1A; supplemental material available online with this article; https://doi.org/10.1172/jci.insight.197310DS1). β Cells, identified by the expression of Ins2, represented 64% of the total islet population in the control group (Figure 1B). Other islet cell types were represented in the following proportions: α 11%, δ 9%, pancreatic polypeptide 2%, ductal 2%, and endothelial 5% (Supplemental Figure 2). Density estimates for the expression of p21 (encoded by Cdkn1a) or p16 (encoded by Cdkn2a) using a Gaussian finite mixture model identified at least 2 subpopulations of senescent β cells: Cdkn1a+ and Cdkn2a+, as well as a third nonsenescent subpopulation of double-negative Cdkn1a–/Cdkn2a– cells. Nonsenescent (Cdkn1a–/Cdkn2a–) β cells represented 75% of the total population of control islets. The remaining senescent cell subpopulations included 29% Cdkn1a+ cells and 0.3% Cdkn2a+ cells (Supplemental Figure 3). These proportions align with reported values of 20%–40% of CDKN1A+ β cells from adults over 60 years old (8). The frequency of the senescent subpopulation in other islet cell types is shown in Supplemental Table 1.
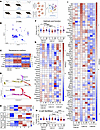 Figure 1
Subpopulations of senescent β cells with different functional and SASP transcriptional profiles. (A) Reanalysis of scRNA-Seq data (GSE149984) of islets isolated from C57Bl6/J male mice (7- to 8-month-old retired breeders) under 3 conditions: control (C), S961-induced insulin resistance for 2 weeks (S), and S961-induced insulin resistance followed by a 2-week recovery period (SR). (B) UMAP plot displaying the major islet-cell cluster of mouse β cells based on Ins2 expression. (C) Heatmap of senescence marker genes with individual z scores. (D) Trajectory analysis scRNA-Seq from nonsenescent to senescent mouse β cells showing different stages along a pseudo-time-course and (E) specific senescent gene expression per metabolic condition. (F) Scatter plots of average z score expression levels of hallmark and functional genes in each subpopulation; mean ± SEM; expression levels analyzed by Wilcoxon’s matched-pairs signed-rank test. Data are results from 2,939 β cells in C, 2,896 β cells from S961R conditions, and 2,513 cells from SR; islets were isolated from 4 mice per condition as previously published (1). The midpoint of 0 represents average expression across all samples. (G) Heatmap of β cell hallmark and function genes. The graph shows the expression of the genes in 3 cell subpopulations of nonsenescent β cells (Cdkn1a–/Cdkn2a–) and Cdkn1a+ and Cdkn2a+ under the 3 metabolic conditions described. (H) Scatter plots of average z score expression levels of β cell SenMayo score. Mean ± SEM; expression levels analyzed by Wilcoxon’s matched-pairs signed-rank test. (I) β SenMayo: heatmap of selected genes related to senescence and SASP in the same 3 cell subpopulations under the different metabolic conditions. **P < 0.001, ***P < 0.0001, and ****P < 0.00001.
To determine whether the upregulation of Cdkn1a and Cdkn2a represented true senescence identities, coexpression with other senescence markers in the various subpopulations was evaluated (Figure 1C). The Cdkn1a+ subpopulation coexpressed cell proliferation regulator Jun and the SASP factors Il6 and Il1b, while the Cdkn2a+ subpopulation coexpressed Glb1, which encodes senescence marker β-gal, and senescence marker Hmgb1. These results support the notion that these 2 subpopulations are in a state of senescence and are distinct from each other.
With insulin resistance, both the Cdkn1a+ and Cdkn2a+ senescent β cell subpopulations increased (Supplemental Figure 3). The Cdkn1a+ subpopulation decreased during recovery, while the number of Cdkn2a+ cells continued to increase (Supplemental Figure 3), indicating distinct dynamics and discrete populations. Principal component analysis (PCA) of the z scores revealed significant clustering by treatment (Supplemental Figure 4); therefore, results are shown for all 3 treatments in each senescent subpopulation. Trajectory analysis of scRNA-Seq from nonsenescent to senescent mouse β cells revealed 5 stages based on transcriptional similarity, 3 of which appear to be alternate senescence fates, which we have named stage 3, A–C, with states 1 and 2 being nonsenescent (Figure 1D). Characteristically, in β cells from all metabolic conditions, stage 3A had the highest Cdkn1a levels, stage 3B was characterized by Cdkn2a expression, and stage 3C had high Trp53 levels, suggesting a stressed cell fate (Figure 1E). Cdkn1a+ β cells in all metabolic conditions had downregulated expression of hallmark β cell genes, including Ins1, Ins2, and Pdx1, as well as functional genes under all metabolic conditions (Figure 1, F and G, and Supplemental Figure 5A). Interestingly, this set of functional genes was not downregulated in senescent Cdkn2a+ β cells (Figure 1, F and G, and Supplemental Figure 5A), revealing potential functional differences between subpopulations of senescent β cells and reconciling previous reports of increased functionality after p16 (Cdkn2a) overexpression in β cells (5). Distinct Cdkn1a+ and Cdkn2a+ subpopulations have also been identified in other tissues, including adipose tissue, liver, and heart (9).
Expression of SASP factors in different senescent subpopulations included genes published in the SenMayo panel (10). To minimize artifacts introduced by specific gene dropout, only genes with quantifiable reads in all 3 subpopulations were included in the analysis and reported as β-SenMayo (Figure 1, H and I, and Supplemental Figure 5B). Compared with nonsenescent and Cdkn2a+ cells, the Cdkn1a+ subpopulation had a significantly higher β-SenMayo score with increased transcripts of Il1b, Plaur, Gdf15, and Fgf1 (Figure 1I and Supplemental Figure 5B), further corroborating its senescent phenotype.
Validation of the senescent p21 cell subpopulation at the protein expression level included the development of a p21-tdTomato (p21-tdTom) reporter mouse model. p21-tdTom mice were generated by CRISPR/Cas9-mediated knockin of a P2A-tdTomato cassette into the 3′ end of the endogenous p21 gene in a bicistronic fashion, leading to the production of 2 proteins, P21 and tdTomato, from the same transcript (Figure 2A). Metabolic evaluation of the p21-tdTom reporter showed no difference between sexes and with respect to WT mice in glucose clearance (Supplemental Figure 6, A and B). Doxorubicin treatment increased Cdkn1a expression and decreased Pdx1 expression in both islets from reporter and non-reporter mice (Supplemental Figure 6, C and F), showing that gene expression was not affected by the transgene construct (Supplemental Figure 6, H and I). Insulin content was also not affected by the reporter (Supplemental Figure 6J). Pancreatic islets isolated from these mice had detectable tdTom-expressing β cells, as shown by IHC (Figure 2B) and live fluorescence microscopy (Figure 2C), confirming effective protein translation. There was a 67% overlap between p21 protein by immunostaining and tdTom red signal by flow cytometry (Figure 2D and Supplemental Figure 7).
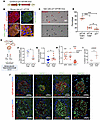 Figure 2
The p21+-β cell subpopulation was dysfunctional and lost its identity. (A) P2A-dTomato transgene used in the generation of p21-tdTomato mice, inserted at the end of the coding region using CRISPR. (B) Panels of different confocal microscopy channels reveal coexpression of insulin and p21 in islet cells; inset shows its nuclear localization. Representative image shown from n = 7 mice. Scale bar: 50 μm. (C) Live fluorescence with bright-field microscopy of dispersed islets isolated from 3-month-old p21-tdTomato (scale bar: 20 μm) and bright-field channel only showing live islet cells. (D) The proportion of tdTomato and p21 in islets analyzed by FACS from 6 tdTomato mice (male and female, 40–65 weeks). Each dot represents 1 mouse. ****P < 0.0001, 1-way ANOVA. (E) Islet isolation, dissociation, and sorting based on tdTomato signal to purify P21-tdTOM+ and P21-tdTOM– for functional analysis. (F) Secretion index = ratio of insulin secreted at 16.8 mM glucose compared with 2.8 mM glucose; n = 3 biological replicates; *P < 0.05 by 2-way paired t test. (G) Basal insulin secretion in P21-tdTOM+ and P21-tdTOM– cells separated by flow cytometry; n = 2–5 technical replicates from 3 biological replicates. Mean ± SEM; islets isolated from 4 male mice (53–70 weeks) and 3 female mice (51–72 weeks). *P < 0.05 by 2-way unpaired t test. (H) Loss of β cell identity at the protein level. Semiquantification of protein intensity in confocal immunofluorescent images from tdTOMhi islets with respect to tdTOMlo. Each point represents an individual islet from 3 P21-tdTOM+ female mice (17–22 weeks). (I) HMGB1 nuclear exclusion frequency in INSULIN+ cells in islets from tdTOMhi and tdTOMlo. Each point represents an individual islet from 3 P21-tdTOM+ female mice (17–22 weeks). (J) Representative images of H and I comparing protein expression of β cell hallmark genes in islets from tdTOMhi and tdTOMlo. tdTomato in red; β cell–related genes and HMGB1 in green. MFI for red channel intensity. Scale bar: 50 μm.
To test the age dependency of the p21 subpopulation, islets from young (3 months old) and aged (18 months old) p21-tdTom mice were dispersed into single cells. p16 was detected by immunostaining, and p21 was detected by endogenous Tomato fluorescence. All 3 subpopulations detected in the scRNA-Seq data were also detected at the protein level in islets from 3-month-old mice (Supplemental Figure 8) in the following proportions: 18% p21+ and 4% p16+, supporting the scRNA-Seq results. The p21+ subpopulation significantly increased with age to 28%.
The function of the p21+ subpopulation was evaluated by isolating and dispersing islets from aged adult male and female p21-tdTom mice (51–72 weeks of age). Flow cytometry was used to separate cells into p21-tdTOM– and p21-tdTOM+ subpopulations, and the response to glucose was evaluated with GSIS (Figure 2E). Senescent p21-tdTOM+ cells had impaired glucose responsiveness, as shown by a decreased insulin secretion index (insulin secretion at 16.8 mM glucose/insulin secretion at 2.6 mM glucose) (Figure 2F) due to increased basal insulin secretion (Figure 2G), a feature typical of dysfunctional β cells (2, 3, 11).
To assess whether the decreased expression of genes related to β cell identity and function observed in the Cdkn1a+ subpopulation was reflected at the protein level, pancreatic sections from p21-tdTom mice were stained for the following antigens and their intensity quantified: MAFA, PDX1, and NKX6.1. The results showed a significant decrease in the protein levels of these β cell transcription factors in islets with high levels of tdTOM compared with islets with low levels of tdTOM, as assessed by semiquantitative immunofluorescence (Figure 2, H and J), confirming loss of cellular identity. Furthermore, HMGB1, another marker of cellular senescence, showed predominant nuclear exclusion in islets with high tdTOM levels (Figure 2, I and J), supporting its senescent identity.
In summary, these analyses identified a Cdkn1a+ (encoding p21) β cell subpopulation that exhibited low glucose responsiveness, loss of β cell identity, and increased expression of well-known senescence and SASP genes.
Non-cell-autonomous effects of the β cell SASP induce secondary senescence. To assess whether SASP factors from senescent β cells had nonautonomous effects on nonsenescent β cells and contribute to senescence, a series of experiments were conducted using complete conditioned media (CM) containing either the full SASP from senescent cells, a selection of 4 SASP factors, or individual SASP factors.
For complete CM experiments, a mouse insulinoma cell line, MIN6, was treated with CM from senescent and nonsenescent cells. CM from senescent cells was generated by treating MIN6 cells with the DNA-damaging agent, bleomycin, which induces senescence and SASP secretion in vitro (4). CM from vehicle-treated cells (control CM) or bleomycin-treated cells (BCM) was collected and used to treat naive MIN6 cells for 24 hours. Five days after exposure to control CM or BCM, cells were collected, and expression of senescence markers and proliferation were analyzed (Figure 3A). Exposure to BCM resulted in increased p16 expression (Figure 3B) and a marginal increase in β-gal activity (Figure 3C), both of which are senescence markers (12).
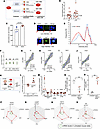 Figure 3
Secondary senescence: β cell SASP has non-cell-autonomous effects on neighboring cells. (A) Workflow to test the effects of SASP on naive MIN6 cells. (B) Effects of BCM on p21 and p16 mRNA expression of naive MIN6 cells (n = 13–14 technical replicates from 3 biological replicates) *P < 0.05, analyzed by nonparametric Wilcoxon’s test. (C) β-Gal+ activity normalized per cell number (n = 4 biological replicates). (D) Cumulative frequency graph of Ki67 staining of MIN6 cells reflecting proliferating subpopulations (cells counted: n = 2,911 for control CM, n = 3,000 for BCM (4 technical replicates in each of 2 biological replicates). (E) Protein quantification by Western blot of selected Cdkn1a+ SASP factors after treatment with p21 siRNA at 50 nM in MIN6 cells (n = 3 biological replicates). (F–I) Expression levels of Cdkn1a-SASP factors from individual samples and their correlations with Cdkn1a expression. Lines of best fit are shown, along with dotted lines indicating 95% CI. P values were calculated using the null hypothesis that the slope of the best fit line equals 0. (J) Treatment of islets from p21-tdTom mice with Cdkn1a SASP factors (LSAMP+DUSP3+GDF15+IDE) during 5 days (female and male, 12–20 weeks old). (K) Cellular subpopulations as determined by flow cytometry of dispersed islets after treatment. (L) Effects of Cdkn1a+ SASP factors on transcription of selected senescence and key β cell genes. (M) Secretion index of islets treated with Cdkn1a+ SASP factors. (N) Basal insulin secretion (n = 4 biological replicates). Mean ± SEM; expression levels analyzed by 2-way t tests. (O–R) Radar plots of qPCR results for the mean expression of senescence and SASP genes. MIN6 cells treated with an individual SASP. Mean ± SEM; n = 2 biological replicates with 2–3 technical replicates each. Concentrations of SASP proteins used in culture media are shown in Table 1. Data shown as mean ± SEM; expression levels analyzed by 2-way t tests; *P < 0.01, **P < 0.001, ***P < 0.0001, and ****P < 0.00001.
Proliferative arrest, an additional indicator of senescence, was analyzed by measuring Ki67 staining intensity in individual nuclei using ImageJ (NIH). A frequency distribution graph of Ki67 intensity revealed 2 main subpopulations: nonproliferative cells (Ki67 intensity < 10 AU, as measured with image analysis software) and proliferative cells (Ki67 intensity > 100 AU) (Figure 3, D and E). MIN6 cells treated with BCM had a greater percentage of nonproliferating cells and a lower percentage of proliferating cells, suggesting induction of senescence. These findings support a non-cell-autonomous effect of the SASP, capable of inducing secondary senescence.
To analyze non-cell-autonomous effects of individual SASP in β cells, 4 factors were selected based on the following criteria: (a) previously published as a senolytic target and/or SASP factor; (b) identified as a SASP factor secreted by β cells in our proteomic analysis (4); (c) common factor between mouse and human SASP and/or reported increase in β cells from donors with T2D (4); and (d) measured concentration in plasma by immunoassay as reported in the Human Protein Atlas (Table 1 and Supplemental Table 2). The following SASP factors met these criteria and were preferentially transcribed by Cdkn1a+ cells: LSAMP, IDE, DUSP3, and GDF15.
To test the dependency of these SASP factors on p21, a conditional siRNA knockdown was developed. At the protein level, conditional downregulation of p21 led to significant decreases in IDE and LSAMP (Figure 3F). At the transcriptional level, a significant positive correlation was observed between Lsamp, Dusp3, Gdf15, and Ide, and the mRNA levels of p21 (Figure 3, G–J). These patterns show that the chosen SASP factors directly correlated with the CDK inhibitor p21, thereby supporting subpopulation specificity.
To test the non-cell-autonomous effects of p21-SASP factors, islets were isolated from male and female p21-tdTOM mice and incubated with a combination of Cdkn1a+ SASP factors (LSAMP, DUSP3, GDF15, and IDE) for 5 days before assessing senescence and function (Figure 3K). Protein concentration levels were determined by reported circulating levels in humans in the Human Protein Atlas; however, the paracrine concentrations are likely higher than those reported in plasma but impossible to measure with currently available technology. SASP from Cdkn1a+ cells significantly increased the p21 subpopulation as measured by flow cytometry (Figure 3L and Supplemental Figure 7) and upregulated p21 mRNA (Figure 3M), while downregulating the key β cell genes Mafa, Pdx1, and Ins1. At the functional level, p21-SASP factors impaired β cell function, as reflected by a lack of glucose responsiveness (Figure 3N), characterized by increased basal insulin secretion (Figure 3O).
To test whether individual p21-SASP factors were able to induce secondary senescence, MIN6 cells were treated with individual proteins for 4 days. All 4 proteins upregulated expression of 6 senescence and SASP genes (p21, p16, Igf1r, Il1a, Il6, and Lsamp) (Figure 3, P–S); LSAMP was the individual factor that induced the greatest increases in expression of senescence genes (Figure 3Q).
These results indicate that SASP factors induced secondary senescence in islet cells in a pathway-specific way: SASP released from p21+ cells increased the p21 subpopulation. SASP factors induced senescence both in combination and individually, implying that a small percentage of senescent p21+ β cells can induce secondary senescence and loss of β cell identity. Based on these findings, the β cell SASP can be considered an additional therapeutic target for restoring β cell identity and functionality.
siRNA-mediated p21 knockdown improves insulin secretion. To evaluate the temporal patterns of p21 and p16 expression in β cells, mouse pancreatic islets were isolated, and a time-course expression was delineated during 12 days in culture (Figure 4A). In control (Scr-siRNA) conditions (Figure 4B), p21 increased from days 6–10; p16 peaked later, at day 10. When p21-siRNA was used to keep levels down, the p16 peak occurred earlier, at day 6 (Figure 4B). This timeframe is consistent with loss of identity and function in p21+ β cells, since the conditional knockdown improved β cell function (Figure 4C) and increased expression of key β cell genes at day 6 (Figure 4D). To examine the role of p21 and p16 in the induction of secondary senescence, these genes were knocked down with siRNA in islet cells exposed to p21-SASP factors (LSAMP, DUSP3, GDF15, IDE) (Figure 4E and Supplemental Figure 9A). From a functional perspective, p21-siRNA improved β cell function under basal conditions but did not rescue the functional loss induced by SASP (Figure 4F), Ins1 nor Mafa transcription (Figure 4, L and M), suggesting additional p21-indedpendent pathways leading to functional and identity loss in secondary senescence. From a transcriptional perspective, knocking down p21 significantly decreased p21-SASP–induced expression (Figure 4G) with no significant changes in p16 expression (Figure 4H). Instead, Mdm2 (p53 negative regulator) (Figure 4N) and Casp3 (apoptosis) (Figure 4K) were upregulated. Proliferation genes Mki67 and Pcna showed the same trend (Figure 4, O and P). No transcriptional changes of p53 (Figure 4I) and Bcl2 (Figure 4J) were detected. Overall, these changes suggest that in the absence of p21, SASP factors induce alternate cell fates such as apoptosis and/or proliferation. These possibilities should be explored further.
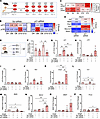 Figure 4
Cdkn1a+ SASP factors induce secondary cellular senescence in mouse pancreatic islets in vitro. (A) Experimental design of the conditional p21 knockdown time-course on mouse islets to assess effects on transcription and function. (B) Time-course expression levels of p21 and p16 mRNA under control (Scr-siRNA) and conditional p21 knockdown (p21-SiRNA, 50nM). (C) Time-course of β cell function as reflected by secretion index at different days after conditional knockdown of p21. (D) β cell hallmark and function genes after p21 conditional knockdown (p21-siRNA) at day 6; 100 islets per condition from retired male breeders, n = 7 biological replicates; data shown as heatmap of z score for B and D, and of secretion index for C. (E) Experimental design for the evaluation of p21-SASP factors after p21 conditional knockdown (p21-siRNA) in mouse islets. (F) Secretion index from static GSIS from p21-siRNA or Scr-siRNA with/without SASP factors (LSAMP+DUSP3+GDF15+IDE) during 5 days. Islets from 33 male C57Bl/N mice were used (6–9 months). (G–P) Transcriptomic gene levels from same experiment design using islets from 24 female and male C57Bl/N mice (17 weeks to 9 months). Mean ± SEM, 1-way ANOVA, *P < 0.05, **P < 0.01, ***P < 0.001.
When p16 was knocked down in islets exposed to p21-SASP factors (Supplemental Figure 9, A and B), there was an increase in p21 expression (Supplemental Figure 9C), with no significant changes in other senescence markers: p53, Bcl2, and Mdm2 (Supplemental Figure 9, D–F). These results suggest that in the absence of p16, senescence might be induced through the p21 pathway.
JAKi restored β cell function, transcriptional identity, and cell subpopulations in mouse islets. SASP secretion and action are known to be regulated by several pathways (13), including the bromodomain and extra-terminal domain (BET) pathway (14), whose regulation was queried in mouse senescent β cells (3). A significant and prominent upregulation of the JAK/STAT pathway (Figure 5A and Supplemental Figure 10) was identified compared with nonsenescent β cells, and JAKi were tested in vitro and in vivo (Figure 5B) to assess their efficacy in maintaining β cell function and identity while decreasing SASP and secondary senescence.
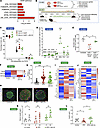 Figure 5
Secondary senescence induced by Cdkn1a+ SASP factors is counteracted by JAK1/2i in mouse islets in vitro and in vivo. (A) Pathway analysis of SASP-regulating pathways in RNA-Seq data from mouse senescent β cells (6) reveals upregulation of the JAK/STAT pathway. (B) Experimental design in vitro: Treatment of islets from p21-tdTom mice with Cdkn1a SASP factors (LSAMP+DUSP3+GDF15+IDE) in combination with JAK1/2i. In vivo: male C57Bl/6N mice were fed a high-fat diet (HFD) for 6 weeks and treated for 4 weeks with JAK1/2i. n = 9 control, n = 11 HFD group, n = 13 HFD + JAK1/2i. (C) Flow cytometry analysis of dispersed islets treated with Cdkn1a SASP factors with or without JAK1/2i. (D) Transcriptional analysis of islets treated with Cdkn1a SASP factors with or without JAK1/2i. (E) Functional analysis of islets treated with Cdkn1a SASP factors with or without JAK1/2i. n = 4 independent experiments. (C–E) Mean ± SEM; expression levels analyzed by 2-way t tests with respect to control; *P < 0.01, **P < 0.001, and ****P < 0.00001. (F) Heatmap showing expression of key senescent genes in islets isolated from different treated groups. (G) Percentage of p21 (red) positive cells in INSULIN (green) positive cells determined by semiquantitative IHC in 3 groups: control, HFD, and HFD+JAK1/2i. Four 16–24-week-old female p21-tdTom mice were used in each group, and 933–1,245 islets were counted per group. *P < 0.05, ***P < 0.0001 by ordinary 1-way ANOVA followed by Tukey’s multiple comparisons test. (H) Representative images of islets immunostained for p21 (red) positive cells in INSULIN (green) in different treatment groups. Scale bar: 50 mm. (I) z score expression of senescence and SASP genes. (J) z score expression of β cell hallmark and functional genes. (K) GSIS by sampling plasma at minutes 0 and 15 during the GTT (i.p.). Mean ± SEM; *P < 0.01, **P < 0.001 by 2-way paired t test. (L) Fed plasma insulin in mice. Mean ± SEM; *P < 0.01 by 2-way unpaired t test.
In vitro, JAK1/2i attenuated the effects of p21-SASP factors by decreasing the p21 and p16 subpopulations of senescent cells measured by flow cytometry (Figure 5C and Supplemental Figure 7). At the transcriptional level, JAK1/2i decreased all tested senescence and SASP genes in islets treated with p21-SASP factors (Figure 5D), while upregulating Mafa, a key transcription factor for β cell function. These positive transcriptional and subpopulation changes were reflected at the functional level. Concurrent treatment of mouse islets with p21-SASP factors and JAK1/2i restored the secretion index, indicating improved β cell functionality (Figure 5E).
The effects of JAKi were also evaluated in vivo with a model of insulin resistance in which mice were fed a high-fat diet (HFD) that increases senescence in β cells (3) and other metabolically relevant tissues (15). Young (8-week-old) C57Bl/6N male mice were fed an HFD during 6 weeks. They received an osmotic pump containing vehicle or a JAK1/2i for the last 4 weeks (Figure 5B). Downregulation of the JAK pathway was confirmed at a transcriptional level (P < 0.02), with no differences in the SMAD/activin pathway, which can be modulated by JAKi. Bulk RNA-Seq of islets isolated from animals in the different treatment groups showed Cdkn1a induction by the HFD (Figure 5F). Also, the HFD increased p21 protein levels, which were suppressed by treatment with JAK1/2i (Figure 5, G and H). At the transcriptomic levels, increased expression of senescence and SASP genes (Figure 5I) and decreased expression of β cell hallmark identity and functional genes (Figure 5J) were observed with the HFD, which were restored by JAK1/2i. Functionally, JAK1/2i restored glucose responsiveness lost after the HFD in vivo, as evaluated during an i.p. glucose tolerance test (GTT) (Figure 5K), and increased circulating insulin levels (Figure 5L).
The peripheral effects of JAK1/2i were evaluated using qPCR in the following metabolically relevant tissues: liver, visceral adipose tissue, and skeletal muscle (Supplemental Figure 11). JAK 1/2i did not have a significant effect on the expression of senescence or SASP genes at the doses used (12.5 mg/kg/day), suggesting a preferential effect on β cells.
These results showed that JAKi decreased senescence genes and subpopulations while restoring β cell function and transcriptional identity in mouse β cells, both in vitro and in vivo.
Human 21+ β cells are dysfunctional and lose transcriptional identity. Analysis of the relevance of the p21+ β cell population to human islets and disease included data from the Human Islets Database (16). CDKN1A transcript levels were significantly increased in islets from donors with T2D compared with islets from donors without diabetes (Figure 6A). Additionally, there was a negative correlation between P21 protein levels and the insulin secretion index (Figure 6B), suggesting that human p21+ β cells are also dysfunctional.
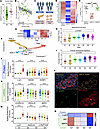 Figure 6
Loss of function and identity in human p21+ β cells. (A) CDKN1A mRNA levels in islets from human donors without diabetes (ND) and with T2D. (B) Linear correlation between p21 protein levels in human islets and their function as expressed by the secretion index. (C) KAPP-Sen study design aimed at mapping and profiling senescent cells in both whole and dispersed human pancreas. (D and E) Heatmap and dot plot of human β cell scRNA-Seq data for selected β cell functional genes across 3 cell subpopulations: nonsenescent β cells (CDKN1A–/CDKN2A–), CDKN1A+, and CDKN2A+. (F) Pseudo-time trajectory analysis of scRNA-Seq from nonsenescent to senescent human β cells. (G) Heatmap showing expression levels of key senescence genes at various stages during the senescence trajectory. (H) scRNA-Seq expression levels of genes in the senescence Gene Ontology (GO) category and (I) Fridman gene senescent scores. Data shows individual cells in each trajectory state, mean ± SEM; expression levels analyzed via 2-way ANOVA. Quartiles of nuclear P21 protein expression derived from spatial proteomic (CODEX) data, only from β cells. (J) Coexpression of senescence proteins within cells exhibiting quartile distribution of nuclear P21. (K) Coexpression of β cell transcripts within cells exhibiting quartile distribution of nuclear P21. (L) Representative image of integrated CODEX (INSULIN [red] and p21 [green] protein) with Xenium (MAFA [orange] transcript). (M) Quartiles of nuclear CDKN1A mRNA expression from Xenium and coexpression with hallmark β cell genes. (N) Heatmap showing overlapping coexpression of nuclear P21 with β cell hallmark genes.
To further profile and map p21+ β cells in human islets, whole pancreas and human islets were obtained as part of the SenNet KAPP-Sen Tissue Mapping Center (Figure 6C). Isolated islets from donors without diabetes across the lifespan underwent scRNA-Seq for transcriptomic analysis, Xenium for spatial transcriptomics, and CODEX for spatial proteomic analysis. The proportion of p21+ β cells in samples from donors without diabetes was 37% per scRNA-Seq (10 donors, aged 34–64 years), 15% by Xenium, and 7% by CODEX (13 donors, aged 21–71 years). These differences might reflect different sensitivity per platform as well as higher senescence induction due to the islet isolation procedure prior to scRNA-Seq.
Key β cell identity and functional genes (INS, NKX6.1) were significantly downregulated in the CDKN1A+ β cell subpopulation when compared with nonsenescent and CDKN2A+ β cells (Figure 6, D and E). To understand whether these senescent subpopulations may have originated from independent lineages or from a single population that expresses these markers in a temporally distinct fashion, as previously suggested by us and others (4, 17, 18), pseudo-time analysis of scRNA-Seq was performed in human β cells. Seven states were identified during the progression of a human nonsenescent β cell to a senescent state (Figure 6, F and G), with states 5, 6, and 7 showing upregulation of key senescent genes: TP53, CDKN1A, and CDKN2A (Figure 6G). State 5 expressed higher levels of TP53, state 6 of CDKN1A, and state 7 of CDKN2A, suggesting a temporal progression of β cells through these 3 senescent stages. In support of these being senescent states, 5, 6, and 7 had significantly higher senescence scores using the gene ontology (GO) term (Figure 6H) and senescence Fridman (Figure 6I) gene datasets.
Given the correlation between p21 with T2D and islet dysfunction in humans, spatial proteomic (CODEX) and transcriptomic (Xenium) analysis focused on CDKN1A/p21+ β cells from fixed whole pancreas. P21 expression was divided into quartiles (Q), with Q1 having the lowest levels and Q4 the highest. At the protein level, β cells with higher levels of P21 also had higher levels of other senescence markers: HMGB1 and XP53BP1 (Figure 6J). Consistent with their loss of identity, this same population had lower levels of key β cell proteins: INSULIN and C-PEPTIDE (Figure 6M). At the transcriptomic level, β cells with the highest levels of nuclear CDKN1A had the lowest levels of INSULIN and MAFA, a key functional transcription factor (Figure 6 K and L). These correlations were maintained when β cells were selected based on nuclear protein P21 levels, and their transcriptional mapping revealed lower levels of INSULIN and MAFA mRNA transcripts (Figure 6N).
These results demonstrate that a senescent and dysfunctional subpopulation of p21+ β cells can be identified in human islets. These cells are more abundant in tissues from individuals with T2D and thus may contribute to β cell dysfunction and T2D pathogenesis.
Pharmacological JAK inhibition restored function of human β cells. To analyze the relevance of JAK inhibition in human β cells as a potential regulator of secondary senescence, data from the Human Islet Program were used (16). JAK1 protein levels were increased in islets from donors with T2D compared with islets from donors without diabetes (Figure 7A). Additionally, there was an inversely negative correlation between JAK1 protein levels and secretion index (Figure 7B), suggesting that human JAK1 might be a potential target to restore β cell function in islets with higher levels of P21+.
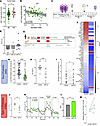 Figure 7
Effects of JAK1/2i on secretion of human β cell function. (A) JAK1 protein levels in human islets from donors without diabetes (ND) and with type 2 diabetes (T2D). (B) linear regression of JAK1 protein levels and secretion index from human islets. (C) Analysis of data from Joslin Diabetes Center’s adult clinic. Longitudinal glycated hemoglobin (A1c) levels from individuals with T2D and who had been prescribed JAKi for medical indications independent from diabetes. The effect of the JAKi treatment was measured by the change of A1c. δA1c = (average A1c post) – (average A1c pre). (D) Mean A1c change before and after starting treatment with a specified JAKi in people with T2D. (E) Workflow of human islets from ND and T2D donors treated with JAK1/2i or JAK1/3i for 4 days. (F and G) Heatmap and dot-plot of SASP (log2 protein abundance) secretion in conditioned media collected from human untreated (control) or treated (JAK1/2i). Top upregulated human β cell SASP proteins were selected. Paired analysis per analyte was performed between conditions. Cell numbers varied from one donor to another but were constant across treatments. Donor 1: 526,000 cells/treatment; donor 2: 192,000 cells/treatment; donor 3: 231,000 cells/treatment; donors 4 and 5: 87,500 cells/treatment. (H) p21 mRNA levels in human islets from ND donors. (I) β cell function evaluated by GSIS in human islets from ND donors with 1–3 replicates per donor. (J) Effects of JAK1/2i in p21 mRNA in islets from T2D donors. (K) β cell function evaluated with islet perifusion in islets from 2 donors with T2D, BMI 38.3 and 42.2, age 58 and 55 years old, respectively. (L) Static GSIS from 2 T2D female donors using JAK1/2i (momelotinib: dark green and baricitinib: light green), both BMI 42.2, age 49 and 55 years old. (M) Matched secretion index from untreated and JAK1/2i-treated islets from individuals with T2D.
Several JAKi are approved for clinical use for different diseases (e.g., rheumatoid arthritis). Deidentified A1c levels were obtained from the Joslin Diabetes Center adult clinic from a limited number of adults with T2D who were also prescribed a JAKi (Figure 7C). Analysis of the longitudinal A1c of each patient revealed that individuals taking JAK1i and JAK1/2i had a 1% decrease in A1c levels compared with levels before the drug was prescribed (Figure 7D).
Based on this rationale, the role of JAK1/2i was tested in human islets. Islets from human donors (Supplemental Table 3) were treated in vitro with JAK1/2i for 4 days, after which CM was collected for aptamer-based proteomic analysis of the SASP (Figure 7E). The top upregulated (Figure 7F) human SASP proteins identified in human β cells (4) were compared between CM from control human cells to CM from human cells treated with JAK1/2i. Treatment with JAK1/2i resulted in a significant decrease in the secretion of SASP proteins (Figure 7, F and G), demonstrating its effectiveness in targeting human SASP.
To analyze the effects of SASP inhibition on senescent subpopulations, islets from donors without diabetes (where P21+ cells and a functional SASP are also found) (4) were treated as described above and analyzed for the expression of P21 mRNA, which was decreased by JAK1/2i (Figure 7H). This was accompanied by an increase in the secretion index in islets from donors without T2D (Figure 7I). Because of the limited islet supply and the presence of senescent β cells in islets from donors of all ages, we have included a range of ages and metabolic conditions to support the pathophysiological importance of this population.
To test whether the JAK pathway was also relevant in a diseased state, islets from donors with T2D were treated with JAK1/2i for 4 days. P21 transcription was significantly decreased (Figure 7J). From a functional perspective, JAK1/2i restored insulin secretion dynamics in the islets from 2 donors with T2D (58 and 55 years old with BMI 38 and 42, respectively) (Figure 7, K and L). This can be seen as a restoration of first-phase insulin secretion and an enhanced response to the secretagogue IBMX. Furthermore, improvement in insulin secretion was observed not only in perifusion but also in static GSIS, and similar effects were observed with 2 JAK1/2i drugs (Figure 7M).
In conclusion, the human β cell SASP is a therapeutic target to restore function during progression of T2D and in established T2D.


